ResearchORC series, Part 2
The Known Scale of ORC Fencing on Amazon
What 584 Sellers Reveal About Stolen Goods Online: Part 2 of a Series on Organized Retail Crime's Online Fences
The Question Part 1 Left Open
Part 1 followed one operation from a storefront in Burien, Washington to a guilty plea. A physical shop bought stolen retail goods for cash, stripped off the security tags, and resold them on Amazon as “Medikus” and on eBay as “ABC STORE 555.” The operation grossed more than $4.5 million and ran over 150,000 transactions before agents seized 74,000 stolen items. The whole arc sat in public data the entire time. That case closed with a question. If one storefront this legible left a trail for six years, how many like it are running right now?
We can now answer part of it. Inside the slice of Amazon we monitor, 584 sellers fit the behavioral profile of an ORC fence as of this study’s early-July 2026 snapshot. The count moves over time, both as seller behavior changes and as our verification standard tightens. This is not an estimate of all of Amazon, and it is not a count of convictions. It is a floor, drawn from what we can see, and it is the first population-level look at online fencing we know of that rests on marketplace behavior rather than survey opinion.
Why Nobody Has This Number
Ask how much stolen retail merchandise moves through online marketplaces and you will get either silence or a number you should not trust. Both problems are real, and honesty about them is where this work has to start.
The first problem is definitional. There is no uniform legal definition of organized retail crime and no standardized national tracking of it. The Congressional Research Service said as much in its 2024 review. When the thing itself is not defined the same way twice, no clean national total can exist.
The second problem is a cautionary tale. In April 2023 the National Retail Federation reported that organized retail crime drove “nearly half” of retail shrink, a figure widely repeated as roughly $45 billion. In December 2023 the NRF retracted it. The number came from mistakenly fusing a 2021 Senate-testimony estimate with survey data, and the association walked it back publicly. It stopped publishing its annual shrink survey the following year.
We do not use the $45 billion figure. We name it here because refusing a bad number is part of earning trust in a good one. What can be defended is narrower and duller. U.S. retail shrink was $112.1 billion in fiscal 2022, about 1.6 percent of sales, and external theft, per the Congressional Research Service’s reading of the same survey, accounted for about 36 percent of that shrink. What share of external theft is organized, and what share resells online, is not reliably known. So instead of guessing at the whole, we measured a part of it directly.
What We Can See, and What We Cannot
Cyber Investigation Services is a licensed private investigation firm with 16 years of work on ecommerce crime, alongside brands and with state and federal law enforcement. The study behind this article draws on the same kind of public marketplace record that reconstructed the Burien case, applied across roughly 84,000 Amazon sellers under our monitoring.
Be clear about the limits of that vantage point. We see public marketplace behavior, meaning what a seller lists, how those listings fare over time, and how the seller ships. We do not see inside Amazon’s warehouses, we do not see a seller’s books, and we cannot open the boxes. So we do not claim to know that any individual seller is guilty of a crime. We claim that 584 sellers exhibit a behavioral profile consistent with fencing, and that the pattern is measurable.
The classification standard combines three things, stated here at altitude. First, what a seller’s catalog is made of, meaning the mix of theft-prone product types. Second, a pattern of repeatedly losing listings in ways honest retailers do not. Third, fulfillment posture, meaning who physically holds and ships the goods. We are not going to publish the thresholds or the signal recipe. A public detection method is a public evasion manual, and the people we study read too. Every one of the 584 sellers shows at least one of these listing losses. The median seller shows 10, and one shows 491.
Every number that follows is a floor. Our universe is what we monitor, not a census of Amazon. Our revenue figures are snapshot estimates, not audited financials, and 44 percent of the cohort carries no estimate at all. Our category breakdowns cover only the quarter of catalog listings we could map to a retail channel. Where the data is thin, we say so in the same breath as the finding.
The Fulfillment Tell
The clearest signal separating this cohort from ordinary sellers is how they ship.
Amazon offers two paths. A seller can send inventory into Amazon’s warehouses and let Amazon pick, pack, and ship it, a model known as Fulfillment by Amazon. Or the seller can hold the goods and ship them personally, called merchant-fulfilled or FBM. That second path matters to a fence for a plain reason. Inventory routed through Amazon’s warehouses is documented on the way in and can be inspected or held. Inventory kept in the seller’s own hands never passes under anyone else’s eyes. Part 1’s Medikus account shipped its own orders. So does most of this cohort.
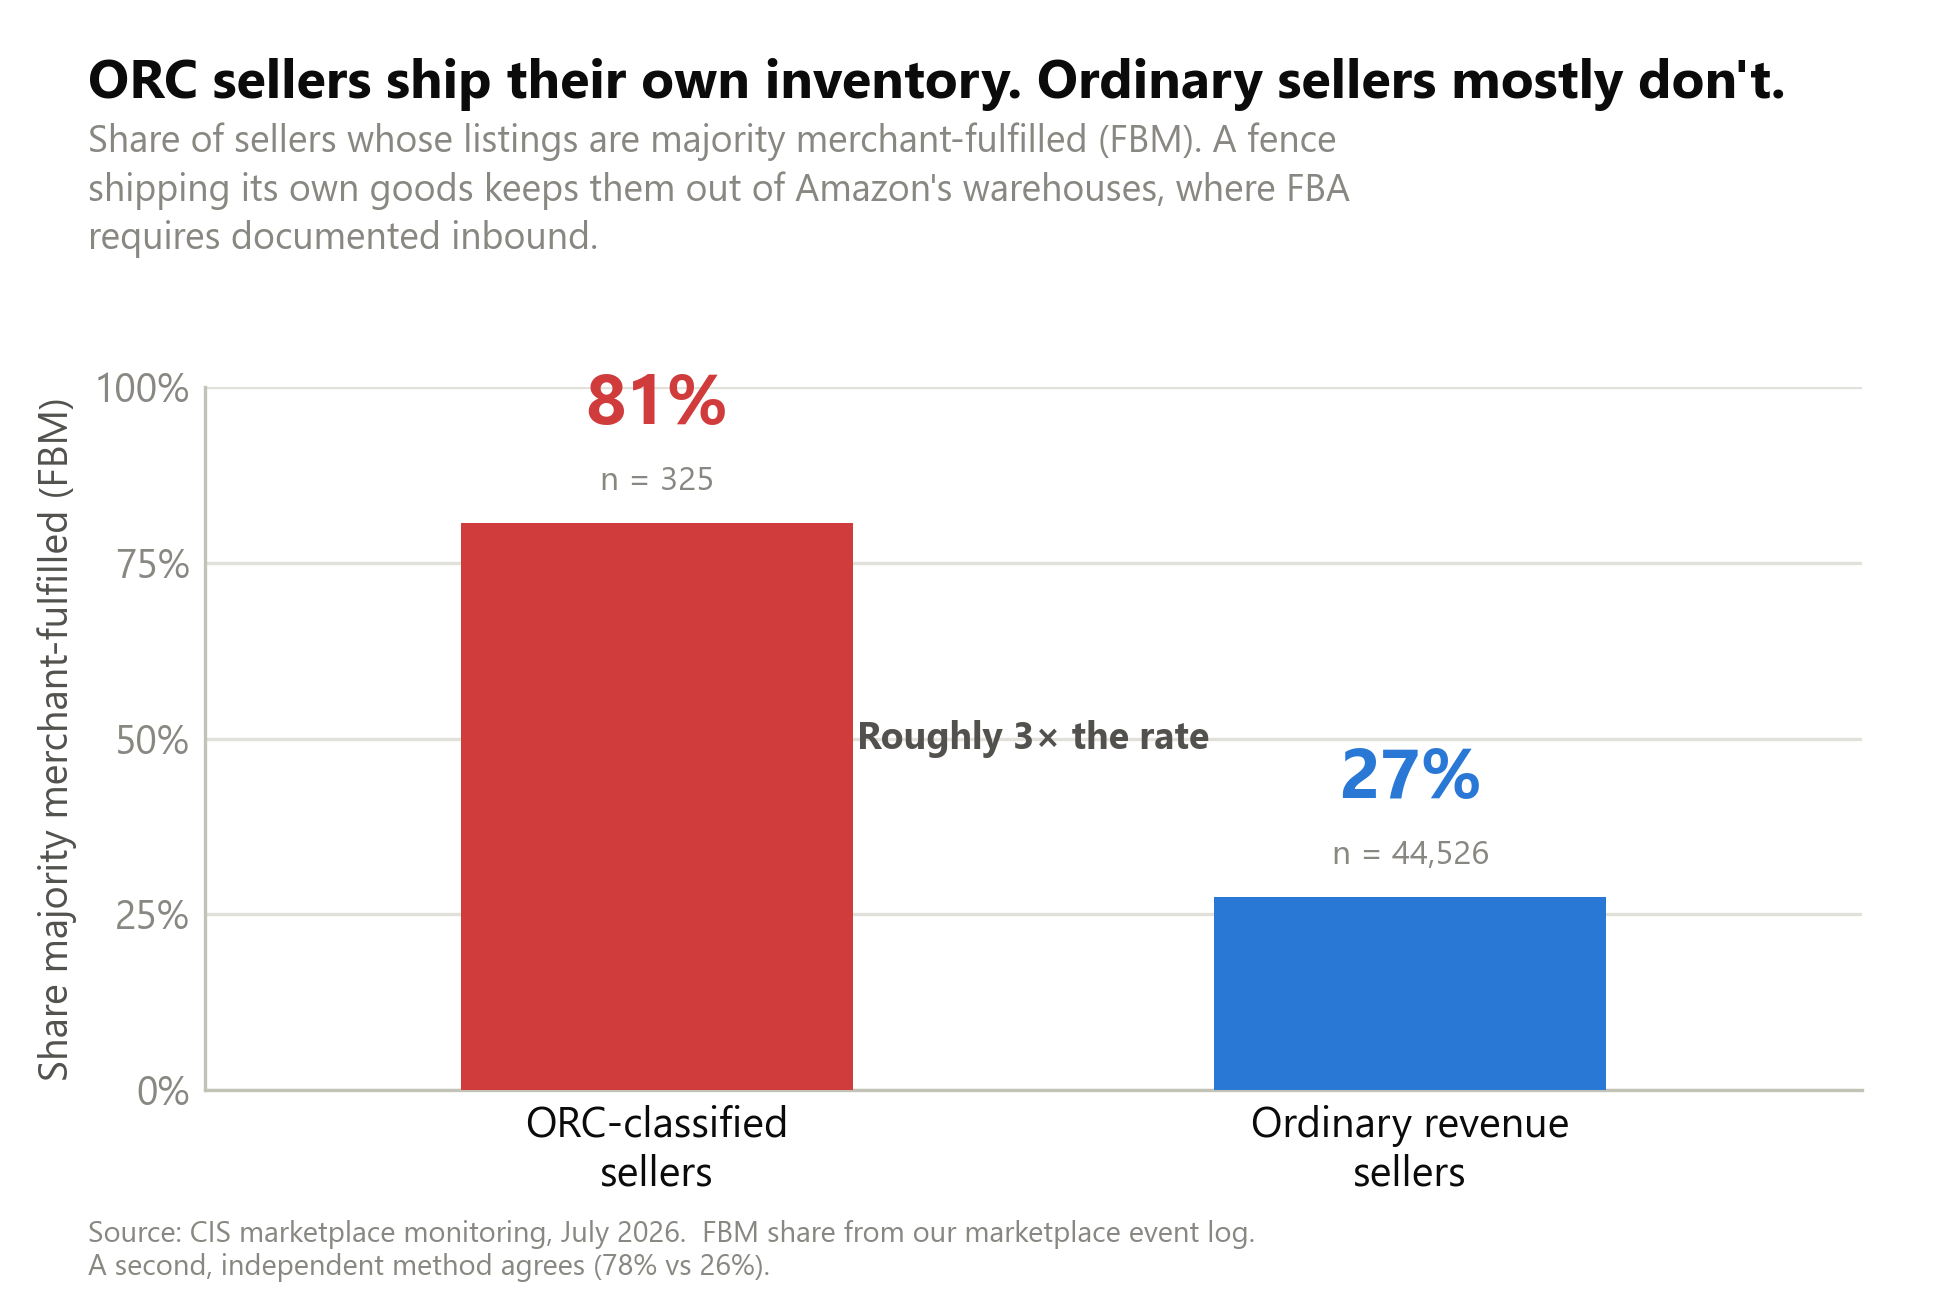
Among ORC-classified sellers with fulfillment data, 81 percent are predominantly merchant-fulfilled. Among ordinary revenue-generating sellers, the figure is 27 percent. A second measurement method, run independently, put the same split at 78 percent against 26 percent. Roughly three times the FBM rate of a normal seller is the single loudest thing this population does in the open.
Small Sellers, Not Big Ones
The next finding cuts against intuition. These are not, by and large, big businesses.
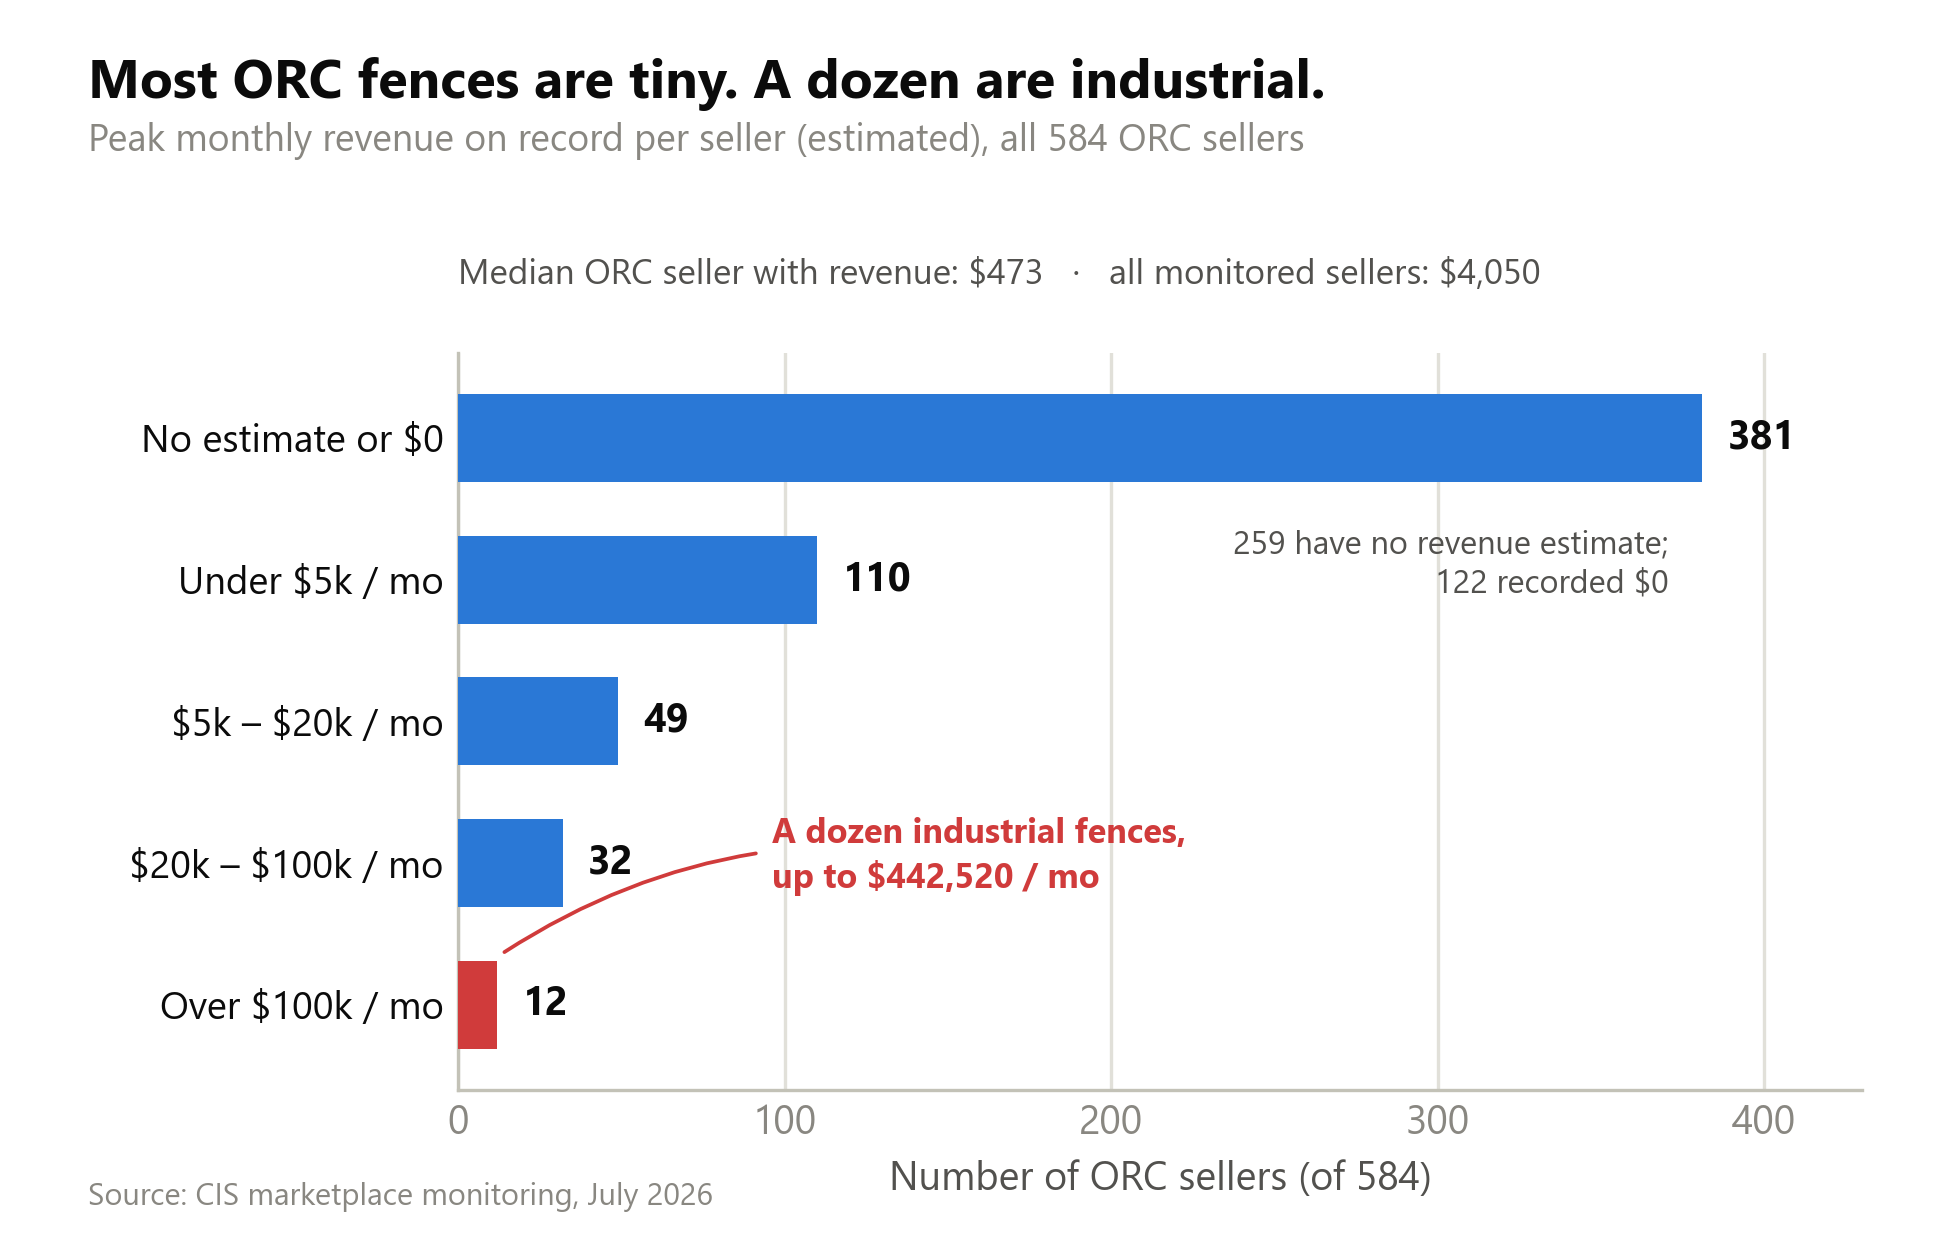
Of the 584 sellers, 259 carry no revenue estimate on record, and another 122 show an estimated $0, so 381 have no measurable revenue in our data. Every revenue statistic that follows is computed over the 325 that carry an estimate. Their median sits at $473 a month. The median across all monitored sellers with revenue data is $4,050, more than eight times higher. The typical classified seller is smaller than the typical seller, not bigger.
There is a reason to read even these small numbers as low. Every revenue figure here comes from public marketplace data, and that data undercounts by design. Commercial trackers credit a listing’s sales to whoever holds Amazon’s Featured Offer, the slot most shoppers know as the Buy Box. They read that holder at the single moment the tracker samples the listing. Sales made while another seller holds that slot go largely uncounted. Estimates of the Featured Offer’s share of all sales vary widely. Industry figures put it around four in five, while the FTC’s 2023 antitrust complaint has been widely reported as putting it near all of them. A second mechanic compounds it. Since early 2023 Amazon has filled U.S. orders through eight largely self-sufficient regional networks, and the Featured Offer winner can differ by customer location. A tracker watching from one vantage point sees a single region’s winner and misses the wins in the other regions. In our casework, when a target seller’s own records surface later, the real volume routinely lands above the public estimate.
The distribution has a tail. Above the crowd of small accounts sit 110 sellers under $5,000 a month, then 49 in the $5,000 to $20,000 band, then 32 in the $20,000 to $100,000 band. At the far end, 12 sellers clear $100,000 a month, and the largest single estimate reaches $442,520. The shape is a floor of many small operators with a thin line of larger ones, not a few big warehouses. The signal here is the count and the behavior, not the size of any one seller. A fence does not need to be large to be a fence.
Where They Sit
The cohort is mostly domestic. Of the 584, 488 are based in the United States, 79 are foreign and overwhelmingly Chinese, and 17 could not be placed.
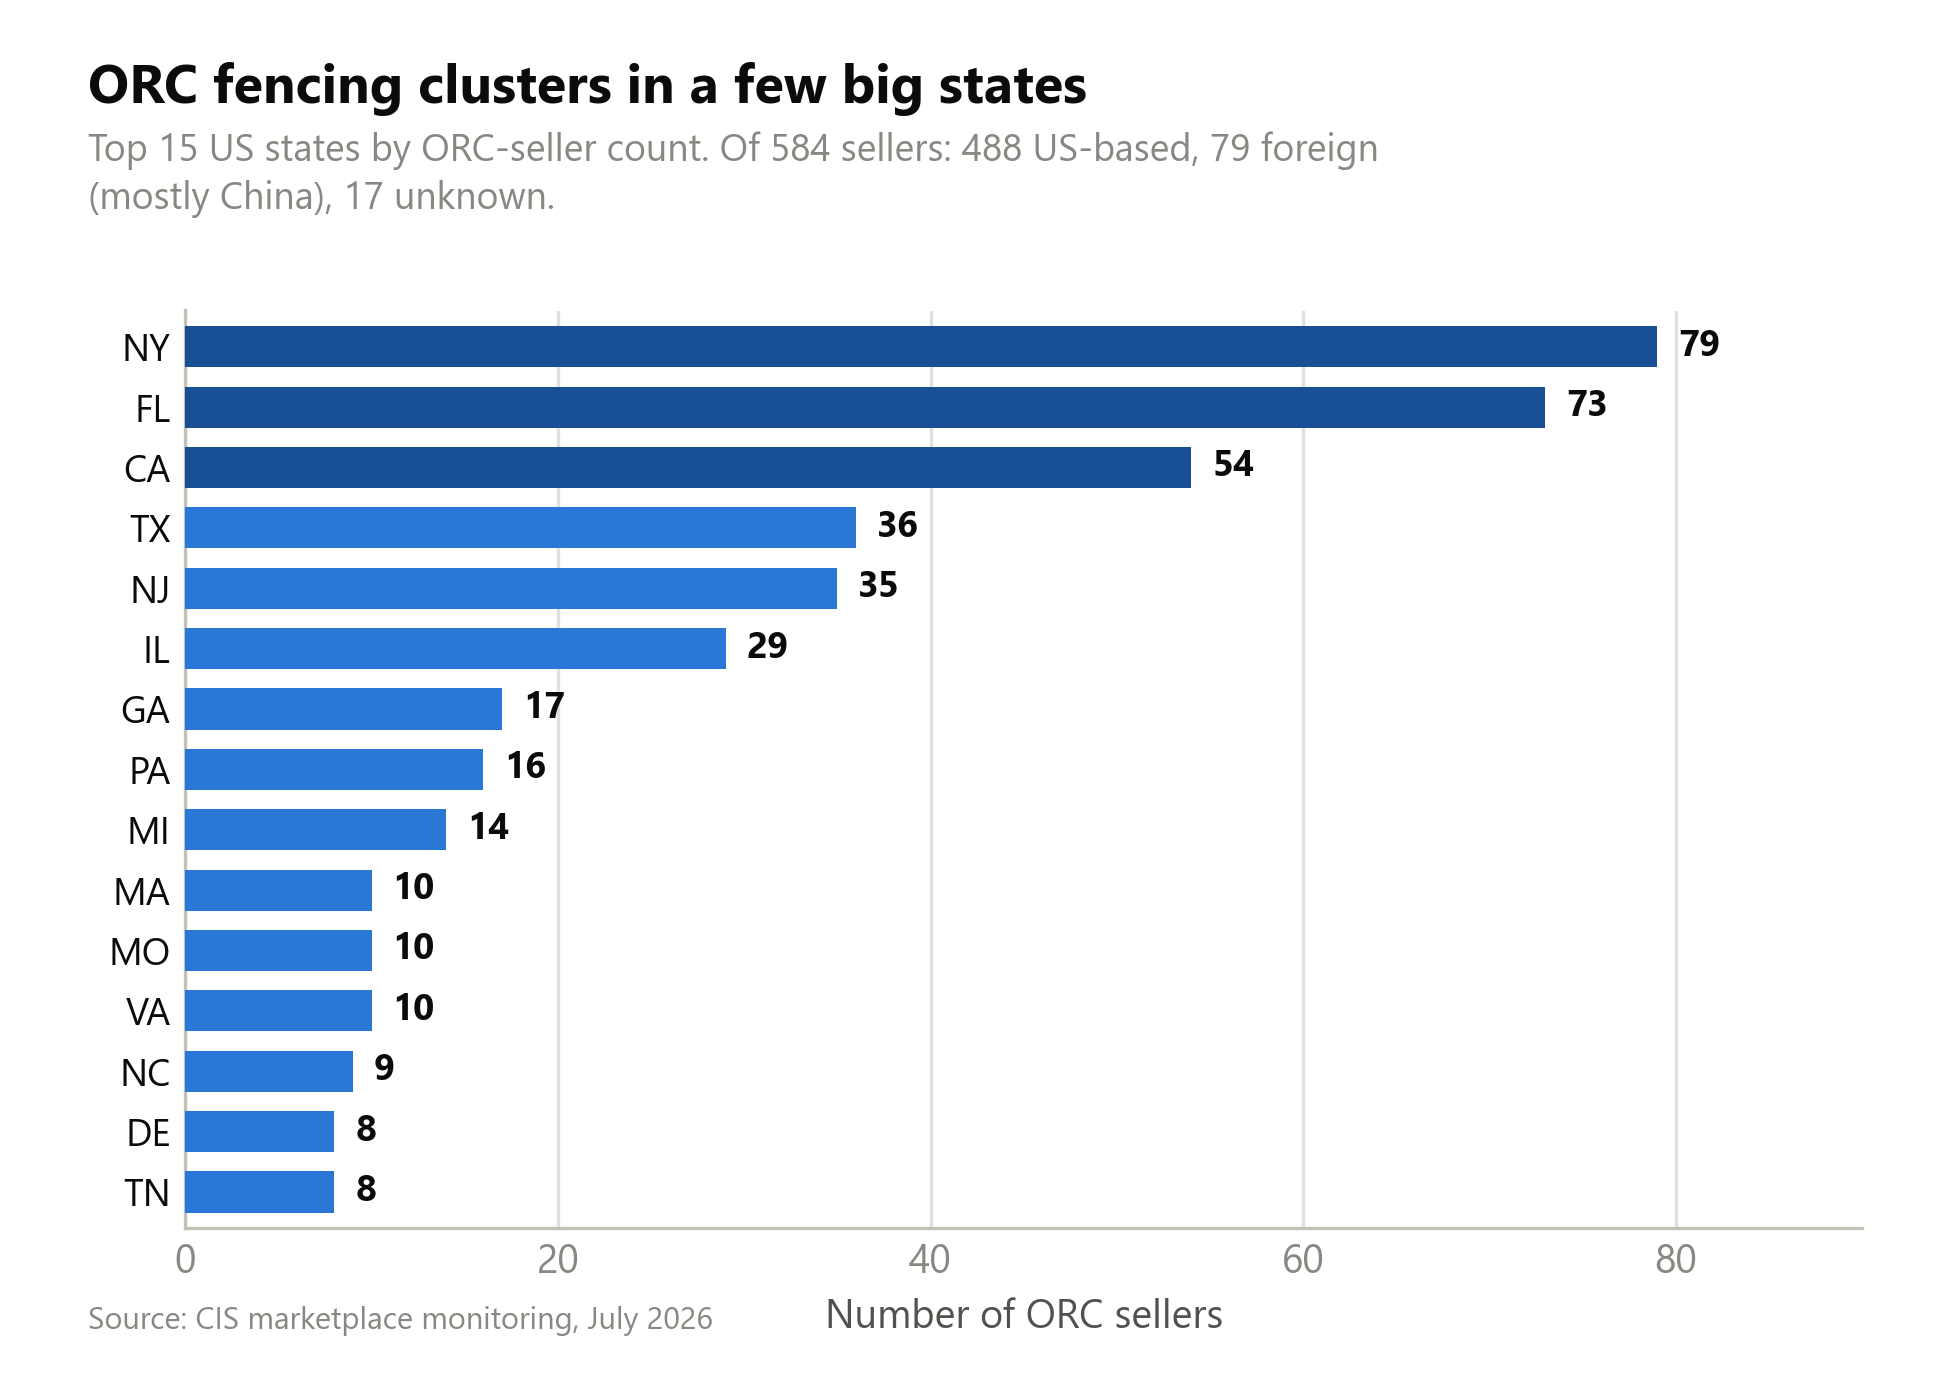
The state ranking runs New York at 79, Florida at 73, California at 54, Texas at 36, New Jersey at 35, and Illinois at 29. The pattern is unremarkable in a telling way. These are large, populous states with dense retail and major ports. There is no exotic cluster, no single town. The distribution looks like the map of American commerce, which is what you would expect if the goods are lifted from ordinary stores across the country.
What Gets Stolen, and From Whom
Map the cohort’s listings back to the kind of store the products come from and one channel dominates the rest.
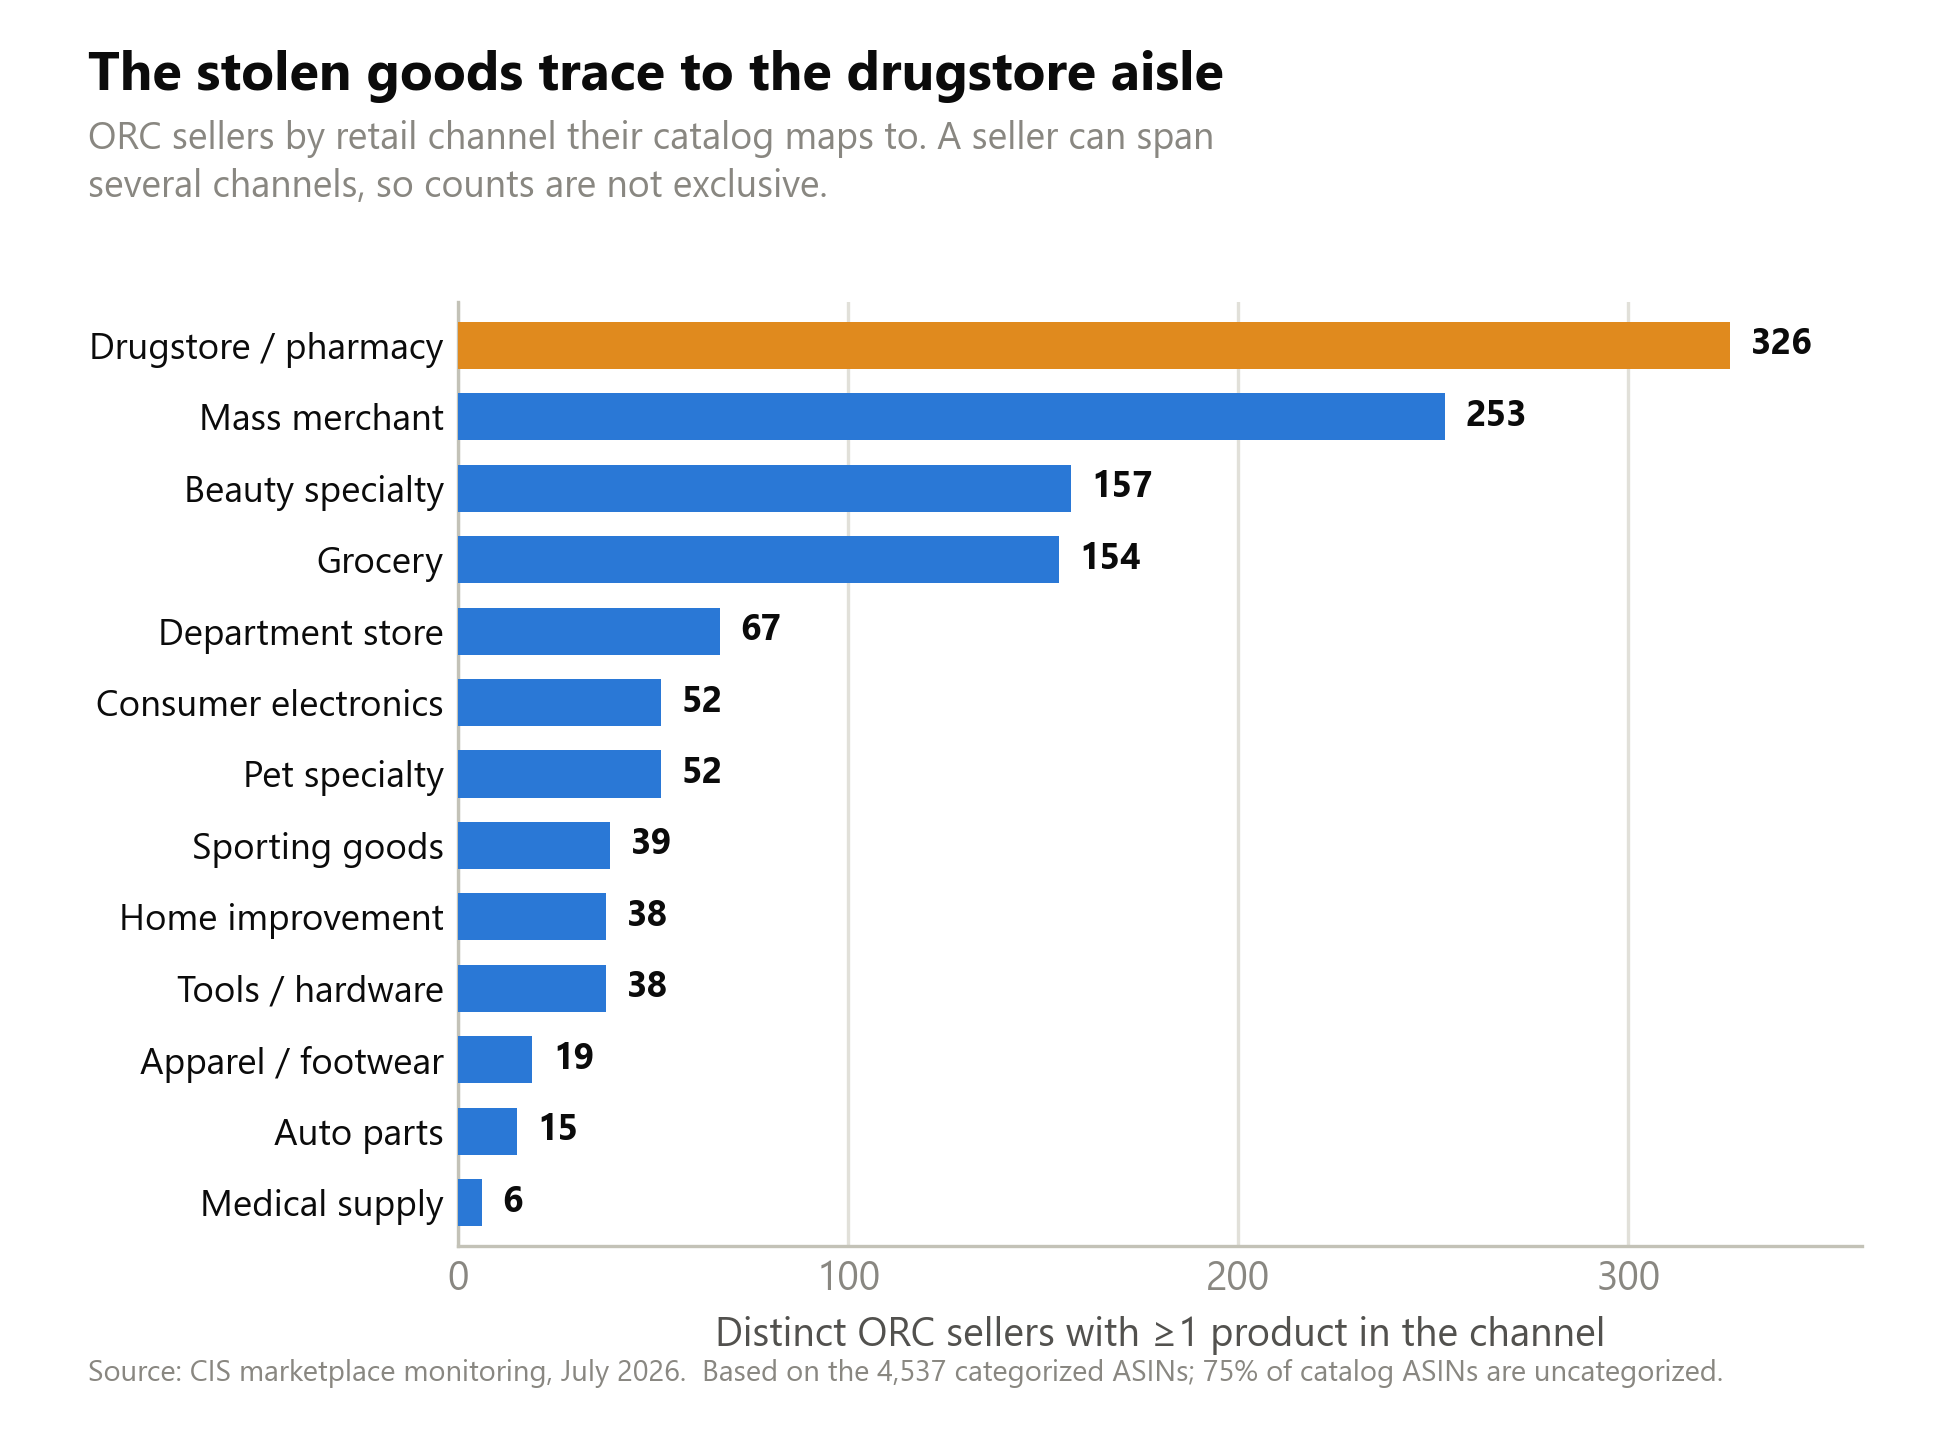
Drugstore and pharmacy merchandise leads, appearing in the catalogs of 326 sellers across 3,361 listings. Beauty-specialty follows at 1,668 listings, then mass-merchant goods at 1,507. Read this against a hard caveat. We could map only 4,537 of the 18,143 distinct listings in the cohort to a retail channel. The other three-quarters are uncategorized, so these are floors on top of floors. The direction is still unmistakable.
The product types name themselves. Hand wash, hair color, soaps, body wash, deodorant, foundation, household batteries, antiperspirant, toothpaste, and lotions sit at the top of the list. These are small, portable, brand-name drugstore consumables. Criminologist Ronald Clarke gave this category an acronym, CRAVED, for concealable, removable, available, valuable, enjoyable, and disposable. It describes the goods a thief can pocket fast and sell easily. It also describes, almost exactly, what this cohort lists. The same product mix ran through the Burien storefront in Part 1.
They Do Not Go Away
A fence that operated once and vanished would be a footnote. This cohort persists.
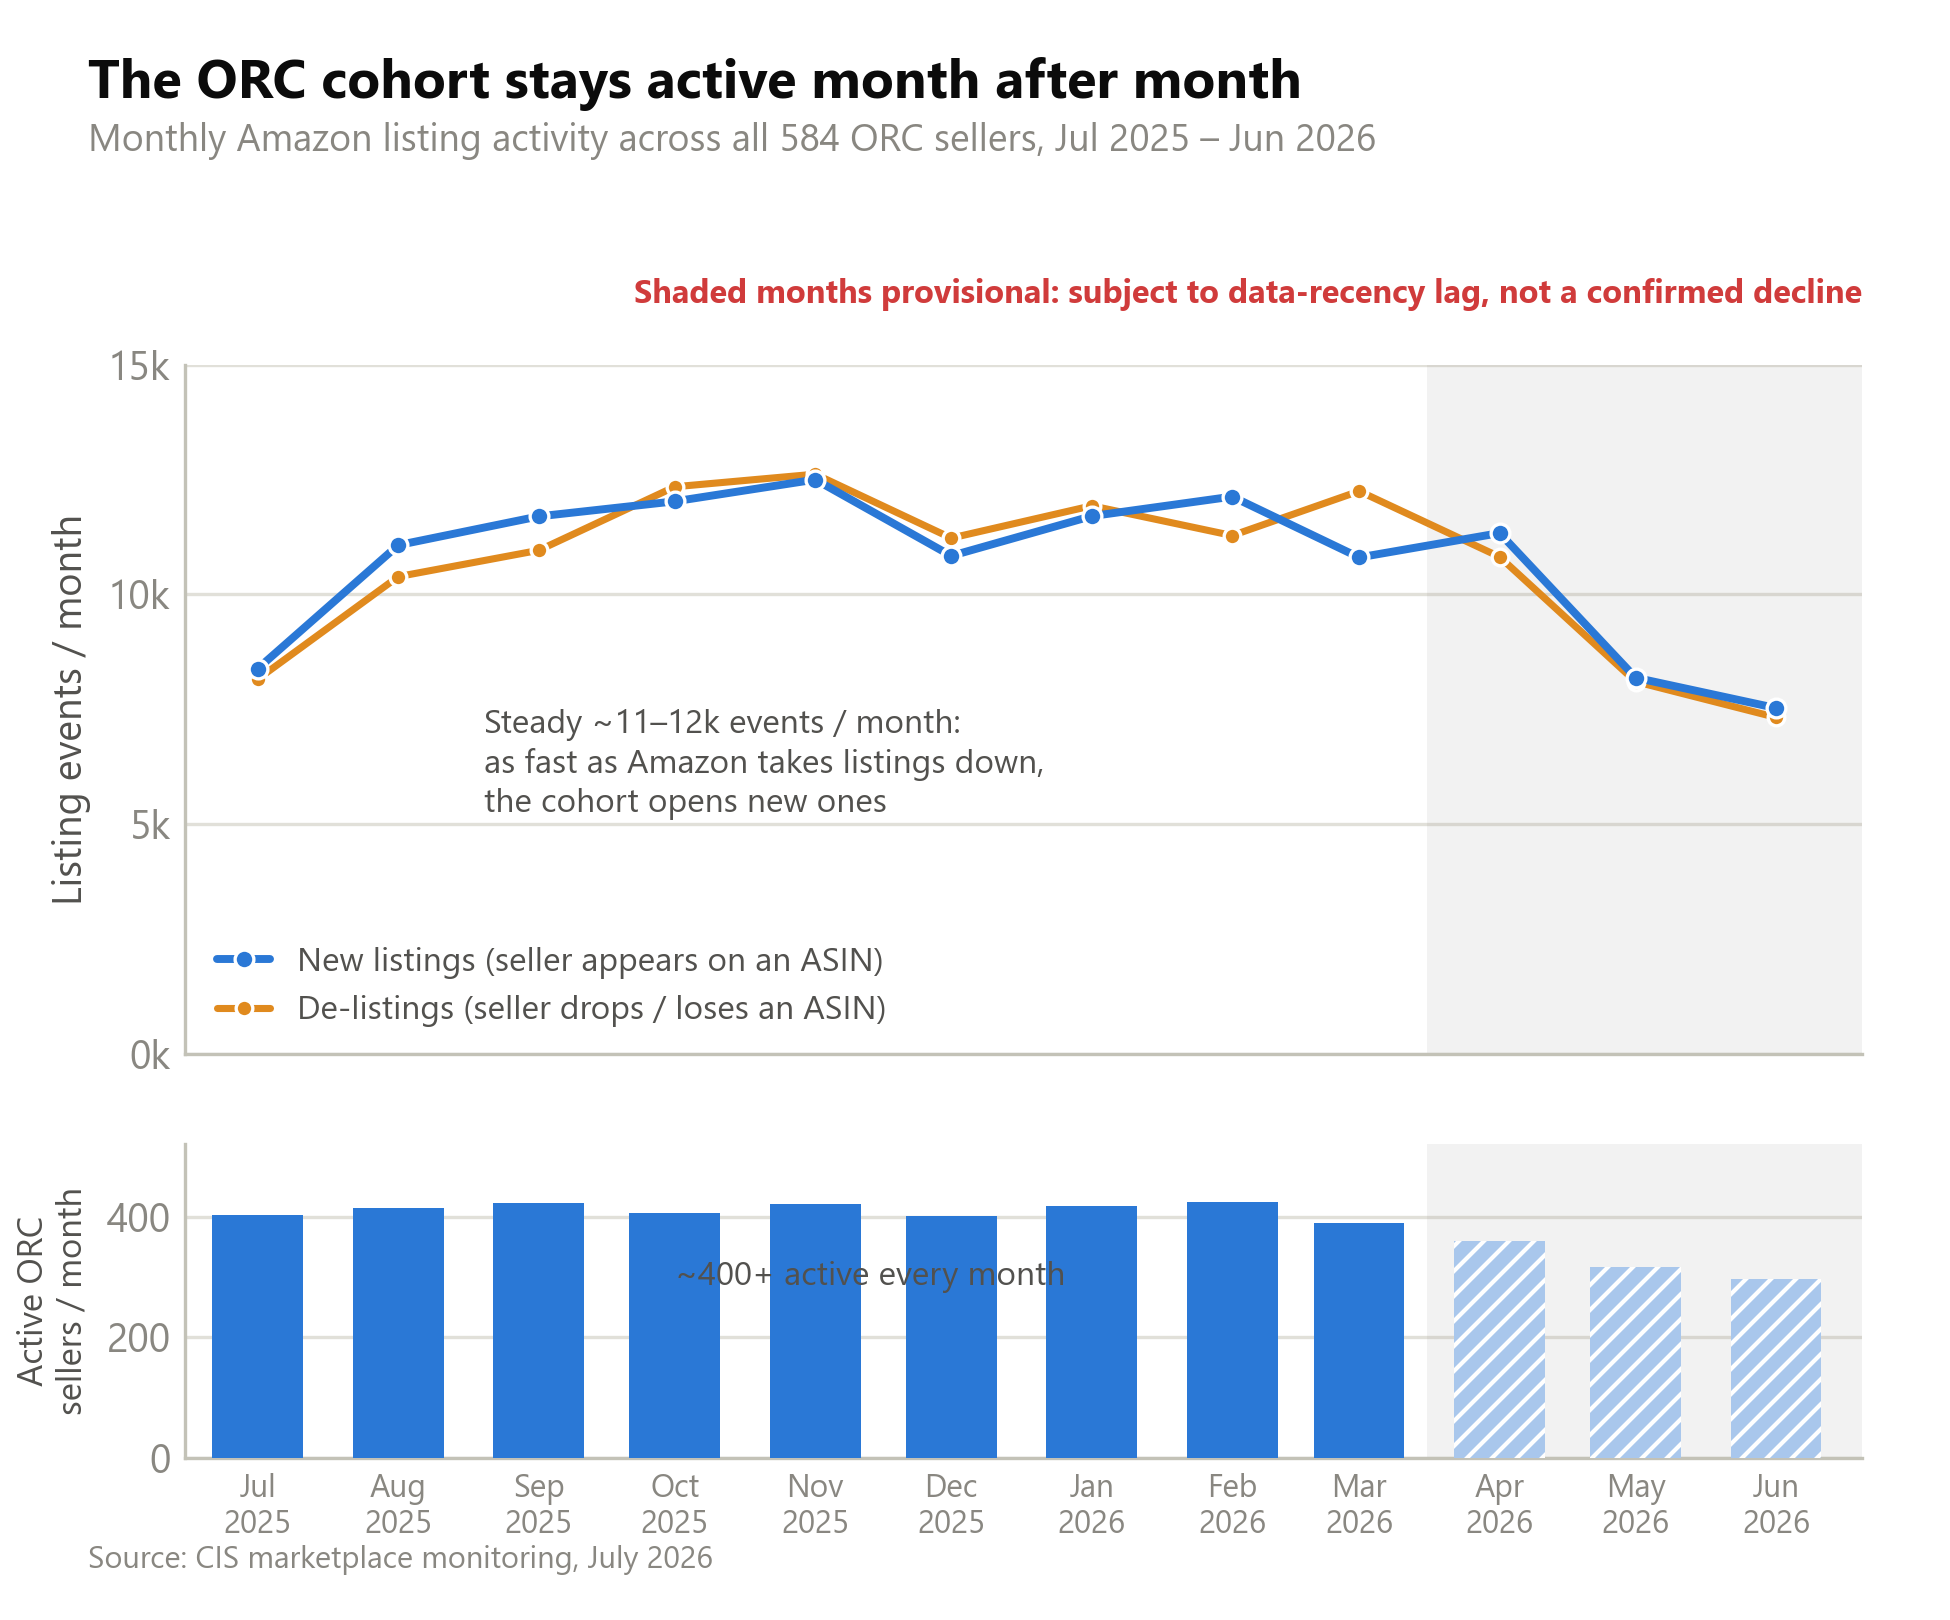
The one honest time series in our data tracks listing activity for the cohort, meaning listings opened and lost month over month. It is a measure of churn, not of dollars, and we label it that way. From July 2025 through March 2026 it runs at roughly 11,000 to 12,000 listing events a month, with more than 400 of the 584 sellers active in any given month. That is a persistently working population, not a spike. The last few months taper downward, but part of that tail reflects data lag, since fewer refresh cycles have accumulated for the most recent weeks. We will not present it as a confirmed decline, because we cannot yet tell contraction from recency.
One number underneath the churn is worth stating plainly. Every one of the 584 sellers has had at least one listing frozen by Amazon, a state we call stranded. The median seller carries 10, and one carries 491. Listings die under these accounts at a rate honest retailers do not experience. That pervasive stranding is a defining signature of the group.
Not an Amazon Problem
Amazon is where we ran this study. It is the largest third-party marketplace, and its public record is deep enough to measure at this scale. It would be a mistake to read the study as an indictment of one company. The machine is the subject, and it changes hosts freely.
The prosecutions bear that out across channels. Roni Rubinov collected stolen goods through a Manhattan pawn shop and resold $1,373,728 of them through an eBay store, in a network the New York Attorney General took down with 41 defendants and, later, an Enterprise Corruption conviction. In Florida, Robert and Jaclyn Dell ran an eBay store called “Anointed Liquidator” whose boosters hit Home Depot stores five and six times a day across seven counties, taking in more than $2 million before a 2026 trial conviction. Frank Santa Maria, running a Kansas City, Missouri pawn shop, resold roughly 100,860 stolen items for about $3.08 million through eBay before pleading guilty in federal court. On Amazon, alongside Burien, Michelle Mack’s “Online Makeup Store” moved about $8 million in stolen cosmetics.
Different storefronts, same operation underneath. Congress reached the same conclusion with the INFORM Consumers Act, effective June 2023, which requires marketplaces to verify high-volume third-party sellers. A federal law written to force seller verification is an official acknowledgment that online marketplaces became the fencing channel. The host is not the point. The fence is.
What a Floor of 584 Implies
Hold onto the word floor. The 584 sellers come from one monitored slice of one marketplace, scored on public behavior alone, with the benefit of the doubt built into every threshold. Sellers we could not clear but could not confirm sit in a separate, larger watchlist we did not count here. The true population on Amazon is larger than 584, and the population across every marketplace is larger still. We will not put a multiplier on that, because an honest floor beats a confident guess.
What the number does establish is that Burien was not rare. The behavioral signature that took years to assemble against one storefront shows up, right now, across hundreds of sellers who are still listing, still shipping their own goods, and still losing listings at a rate no clean retailer does. The fence did not disappear when it moved online. It multiplied and hid in ordinary traffic.
That leaves the practical question for anyone who owns a brand or a store. If the fence side is this visible, what can be done about it? Part 3 takes up what retailers and brands can do with a signal like this one.
A Note on Method
This study rests on public marketplace behavior across roughly 84,000 Amazon sellers under CIS monitoring, not on inside access to Amazon or to seller financials. The 584-seller figure is a classification of behavior, not a finding of guilt against any individual. Revenue figures are snapshot estimates, and 44 percent of the cohort has none, so every revenue statistic here is computed over the sellers who do. Those estimates read low for structural reasons as well. Public trackers see only the Featured Offer, sampled at one moment and from one regional vantage. A seller’s true sales run above that figure, not below it. Category and store-type breakdowns cover only the 4,537 of 18,143 catalog listings we could map to a retail channel. The activity series measures listing churn, not revenue, and its most recent months are affected by data lag. Throughout, the numbers mark a floor of what is visible, never a ceiling on what exists. We name no seller from our own data, because classification is not adjudication.
Sources
- Congressional Research Service, R48061, organized retail crime overview: https://www.congress.gov/crs-product/R48061
- National Retail Federation, National Retail Security Survey 2023 (shrink $112.1B): https://nrf.com/media-center/press-releases/shrink-accounted-over-112-billion-industry-losses-2022-according-nrf
- CNBC, NRF retraction of the ORC shrink claim (Dec 2023): https://www.cnbc.com/2023/12/07/us-retail-lobbyists-retract-key-claim-on-organized-retail-crime-accounting-for-inventory-losses.html
- NRF, “Addressing the elephant in the room”: https://nrf.com/blog/addressing-elephant-room-organized-retail-crime
- U.S. Government Accountability Office, GAO-11-675 (e-fencing economics): https://www.gao.gov/products/gao-11-675
- INFORM Consumers Act, effective June 27, 2023: https://www.cnbc.com/2023/06/27/the-inform-act-takes-effect-targeting-organized-retail-theft.html
- U.S. Immigration and Customs Enforcement, HSI Operation Boiling Point launch release (2022): https://www.ice.gov/news/releases/hsi-launches-operation-boiling-point
- New York Attorney General, New Liberty Loans / Rubinov takedown (2022): https://ag.ny.gov/press-release/2022/combating-crime-attorney-general-james-and-mayor-adams-take-down-massive-retail
- New York Attorney General, Rubinov network convictions and sentencings (2025): https://ag.ny.gov/press-release/2025/attorney-general-james-announces-convictions-and-sentencings-members-massive
- Florida Attorney General, “Anointed Liquidator” / Dell ring charges (2023): https://www.myfloridalegal.com/newsrelease/another-retail-theft-ring-shut-down-attorney-general-moodys-florida-organized-retail
- Tampa Bay Times, Dell trial conviction coverage (2026): https://www.tampabay.com/news/crime/2026/03/20/pinellas-home-depot-shoplifting-ring-st-petersburg-robert-jaclyn-dell/
- U.S. Department of Justice, W.D. Mo., Frank Santa Maria guilty plea (2023): https://www.justice.gov/usao-wdmo/pr/pawn-shop-operator-pleads-guilty-3-million-scheme-sell-over-100000-stolen-items-online
- Ronald V. Clarke, “Hot Products” (CRAVED framework), UK Home Office (1999).
- Amazon Science, U.S. fulfillment network restructured into eight largely self-sufficient regional networks (rollout began January 2023): https://www.amazon.science/news-and-features/how-amazon-reworked-its-fulfillment-network-to-meet-customer-demand
- Amazon, Sell on Amazon, Featured Offer (the “Buy Box”) definition and location-based eligibility: https://sell.amazon.com/blog/buy-box-featured-offer
- Feedvisor, “Amazon Buy Box,” industry estimate that roughly four in five Amazon sales pass through the Featured Offer (flagged by the source as an estimate, not Amazon-confirmed): https://feedvisor.com/university/amazon-buy-box/
- Federal Trade Commission v. Amazon (2023), as reported: the complaint has been widely reported as stating that nearly all Amazon sales flow through the featured position: https://www.ibtimes.co.uk/amazon-price-manipulation-antitrust-cases-1808773
- CIS proprietary monitored-seller dataset, 2025 to 2026. Keepa historical marketplace data.
About Cyber Investigation Services
Cyber Investigation Services is a licensed private investigation firm with 16 years of work in ecommerce crime. The firm builds intelligence on counterfeit, stolen, and diverted goods moving through online marketplaces, and works with brands and law enforcement to act on it.