ResearchCounterfeit series, Part 2
The Known Scale of Counterfeit Selling on Amazon
What 541 Sellers Reveal About Fake Goods Online
The Question Everyone Asks and No One Answers Well
Buy something on a marketplace and a small doubt rides along with it. Is this the real thing, or a good imitation of it? The doubt is rational. A counterfeit is not diverted from a store shelf. It is manufactured to imitate a brand, shipped across a border, and sold beside the genuine article at a price close enough to pass. The listing looks ordinary. The product inside the box may not be.
So how much of the marketplace is fake? It is the obvious question and the hardest one to answer honestly. Most numbers that get quoted collapse under a close look. We could not measure the whole marketplace either. What we could do was measure a piece of it directly. Inside the slice of Amazon we monitor, 541 sellers fit the behavioral profile of a counterfeit operation as of a July 16, 2026 snapshot. That is not a count of all of Amazon, and it is not a count of convictions. It is a floor, drawn from what we can see.
Why Nobody Has a Trustworthy Number
Ask what share of goods online are counterfeit and you will get either a shrug or a figure you should not repeat. Both outcomes trace to the same root. Nobody can open every box.
Start with the numbers that get thrown around, because refusing the bad ones is part of earning trust in a good one. You will see claims that some fixed percentage of online sales are fake. There is no defensible source for a figure like that, so we do not use one. You will also see a single global dollar total presented as if it measured counterfeits alone. It usually does not. It fuses counterfeit and pirated goods, or mixes base years, and the scope quietly disappears when the number gets repeated. We keep the scope attached or we drop the number.
What can be defended is narrower and duller. In a study published in 2018, the Government Accountability Office bought 47 items from third-party sellers on popular websites and had the rights holders examine them. Twenty came back counterfeit. That was a small purposive sample chosen to probe risky categories, not a market-wide rate, and we will not stretch it into one. It still means that in one federal test of ordinary marketplace buys, nearly half were fake. Hold that as a data point, not a percentage of the internet.
What the Border and the Trade Data Show
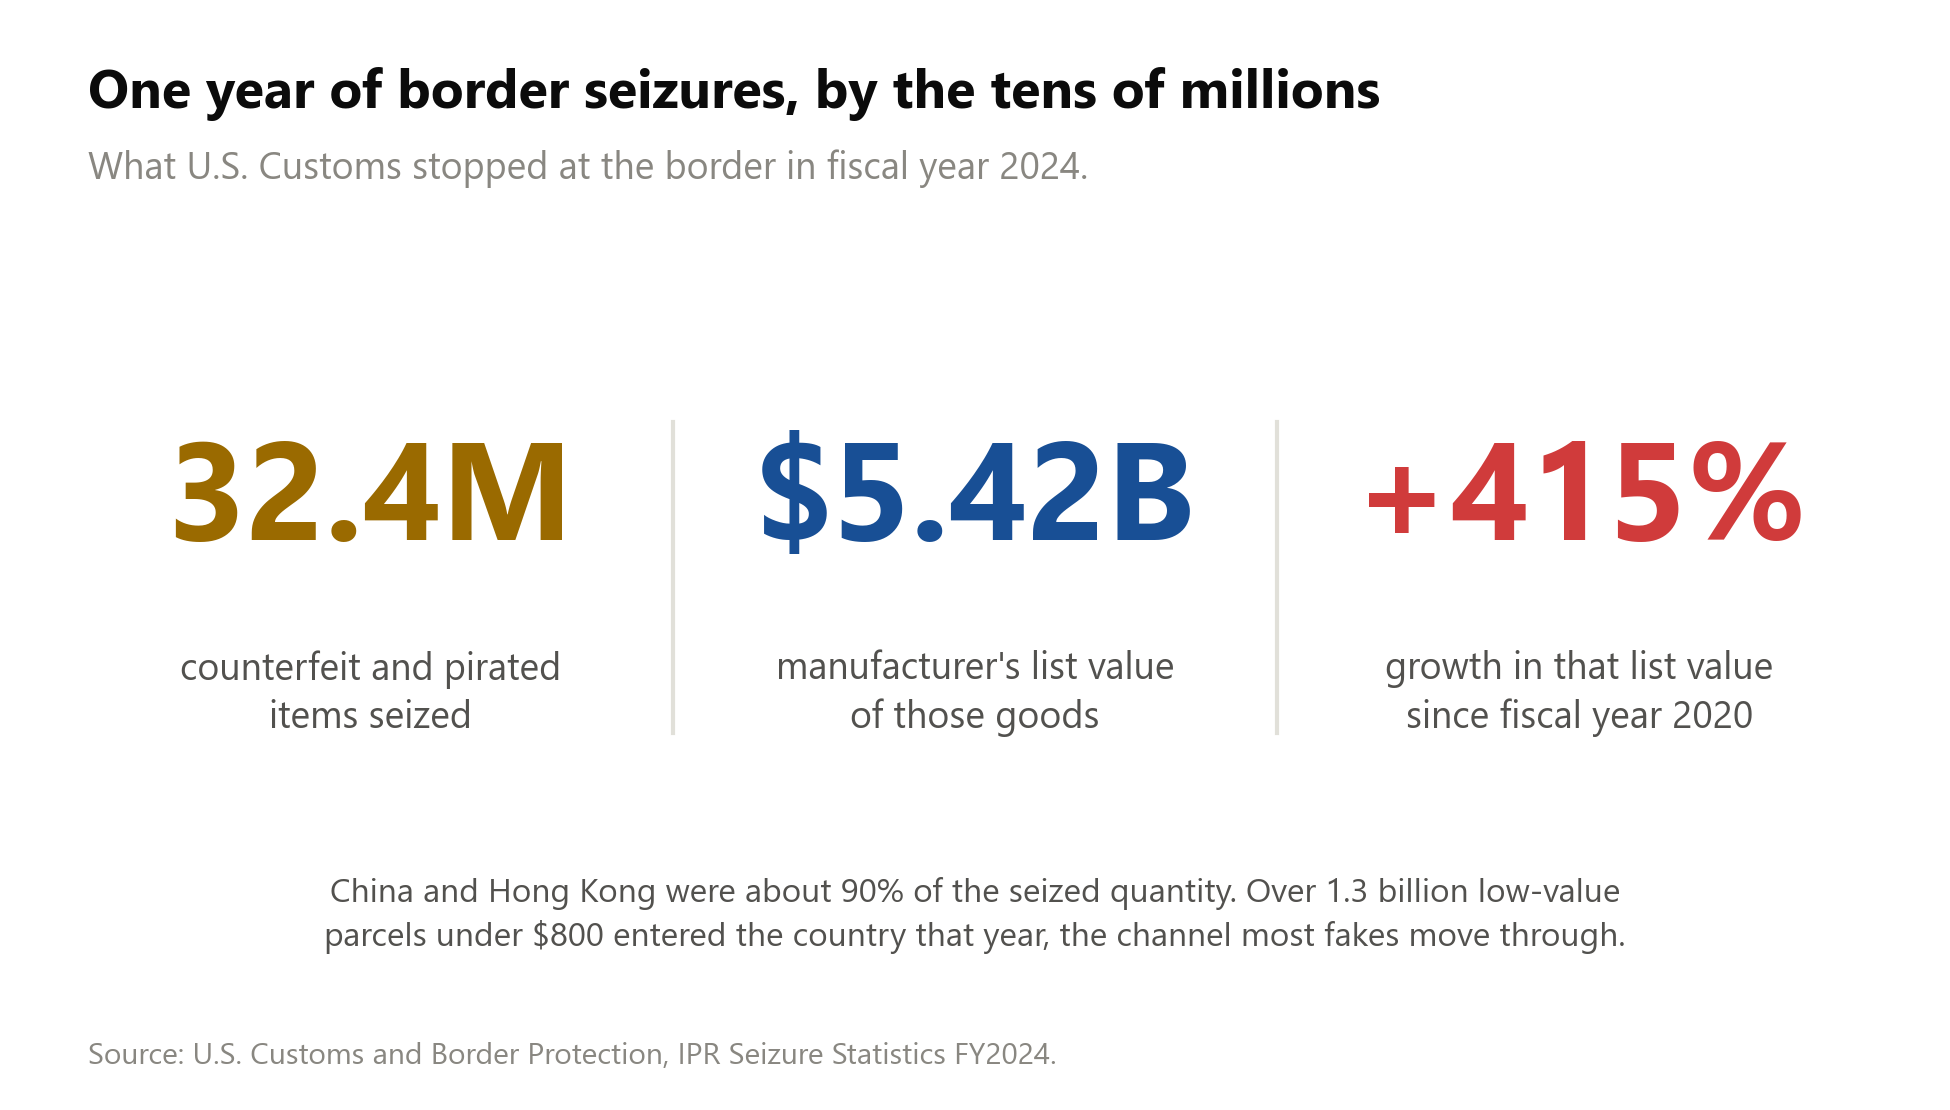
The scale is easiest to see where the goods cross a physical line. In fiscal year 2024, U.S. Customs and Border Protection seized 32.4 million counterfeit and pirated items with a manufacturer’s list value of $5.42 billion. China and Hong Kong accounted for about 90 percent of the seized quantity. From fiscal 2020 to fiscal 2024, the list value of seized goods rose 415 percent. These are only the shipments that got caught. Customs processed more than 1.3 billion low-value parcels under $800 that year, the channel most fakes move through.
The trade estimate sits above the border catch. The OECD and the EU Intellectual Property Office mapped the trade in 2025. They found that “global trade in fake goods reached USD 467 billion” in 2021, up to 2.3 percent of all global trade. Around 65 percent of seizures involve small parcels and mail, which is the e-commerce shipping pattern almost exactly. The Department of Homeland Security named the channel in 2020. “The rapid growth of e-commerce has revolutionized the way goods are bought and sold, allowing for counterfeit and pirated goods to flood our borders.”
Platforms are not standing still, and the scale they concede is its own kind of evidence. Amazon’s 2024 Brand Protection Report offers the company’s own numbers. It says Amazon blocked more than 99 percent of suspected infringing listings before a brand ever flagged them. Amazon also claims it “identified, seized, and appropriately disposed of more than 15 million counterfeit products worldwide” in 2024. Its Counterfeit Crimes Unit has pursued more than 24,000 bad actors since 2020, the company says. Treat those as the company’s own claims. A firm does not stand up a unit that size against a small problem, and fakes still reach customers through the defenses that exist.
What We Can See, and What We Cannot
Cyber Investigation Services is a licensed private investigation firm with 16 years of work on ecommerce crime, alongside brands and with state and federal law enforcement. The study behind this article draws on public marketplace behavior across roughly 84,000 Amazon sellers under our monitoring. It is the same kind of record a court can reconstruct after the fact, read forward instead of backward.
Be clear about the limits of that vantage. We see what a seller lists, how those listings fare over time, and how the seller ships. We do not see inside Amazon’s warehouses, we do not see a seller’s books, and we cannot open the boxes. So we do not claim to know that any individual seller is guilty of a crime. We claim that 541 sellers show a behavioral profile consistent with counterfeit selling, and that the pattern is measurable.
The classification works at altitude, and it stays there in public. A seller enters the counterfeit cohort when it repeatedly loses listings of counterfeit-prone product types in ways honest retailers do not, while it keeps selling. Those product types are classed as counterfeit-prone from public data on what counterfeiters actually target. Sellers our analysts clear are removed. We do not publish the thresholds or the recipe, because a public detection method is a public evasion manual, and the people we study read too.
Every number here is a floor. Of roughly 84,000 monitored sellers, 541 fit the profile, about 0.6 percent of the universe. The classification re-scores every few hours and tightens as it runs, so the counts drift. Classification is a lead, not a conviction. We name no seller from our own data.
Real Businesses, Not Small Ones
The first finding is where counterfeiters part company with the stolen-goods fences we studied earlier. Fences are mostly tiny. Counterfeiters are not.
Over the 421 cohort sellers that carry a positive revenue estimate, the median peak monthly revenue on record is $35,290. Another 79 carry no estimate, and 41 estimate at $0, so the median is computed only over the 421 that register. In our published study of stolen-goods fences, the same-snapshot median was $3,492, over 170 fences with an estimate. For all monitored sellers it is $7,791, over 36,272 with an estimate. The typical counterfeit seller runs about ten times the size of the typical fence and about 4.5 times the typical monitored seller. We report medians only. The cohort’s extreme top includes apparent brand-owned storefronts that trip the same behavior, so a sum or a maximum would carry those artifacts into the headline.
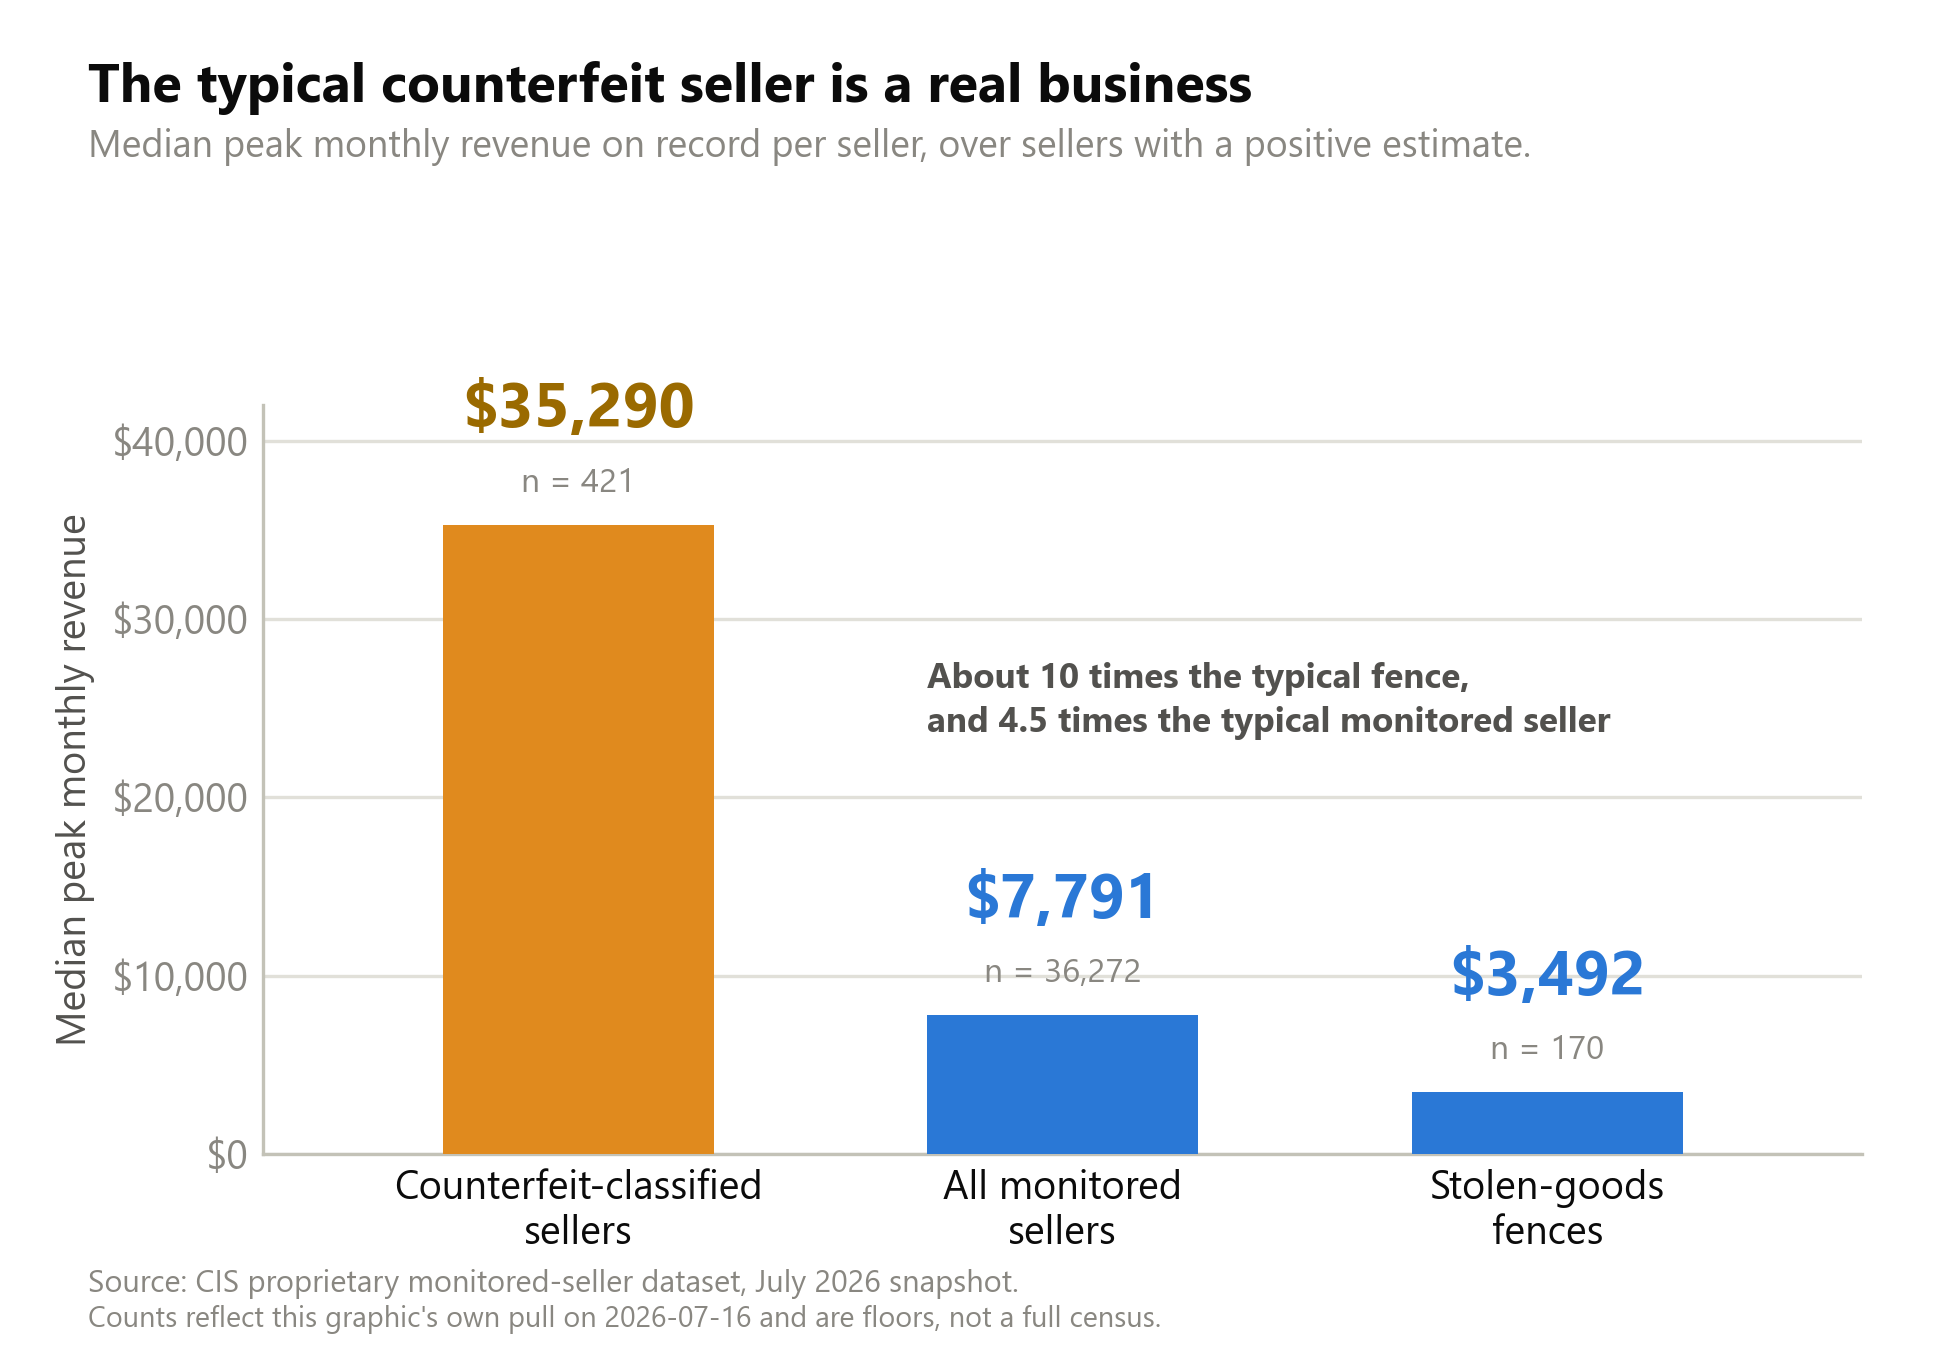
The distribution has weight up top, which the fence cohort never showed. Of the 421 sellers with an estimate, 79 sit under $5,000 a month, then 77 in the $5,000 to $20,000 band, then 131 in the $20,000 to $100,000 band. At the far end, 134 clear $100,000 a month. That is a third of the estimated cohort operating at a scale that reads as a going business, not a side hustle.
Read even these figures as low. Every revenue number here comes from public marketplace data, and that data undercounts by design. Commercial trackers credit a listing’s sales to whoever holds Amazon’s Featured Offer, the slot shoppers know as the Buy Box. They read that holder at the single moment the tracker samples. Since early 2023 Amazon has filled U.S. orders through eight largely self-sufficient regional networks, and the Featured Offer winner can differ by customer location. A tracker watching from one vantage sees one region’s winner and misses the wins elsewhere. In our casework, when a seller’s own records surface later, the real volume routinely lands above the public estimate. We say that as experience, not as a measured figure.
The Fulfillment Divergence
How a seller ships tells you something about what the seller is hiding. Amazon offers two paths. Send inventory into Amazon’s warehouses and let Amazon pick, pack, and ship it, a model called Fulfillment by Amazon. Or hold the goods and ship them yourself, called merchant-fulfilled.
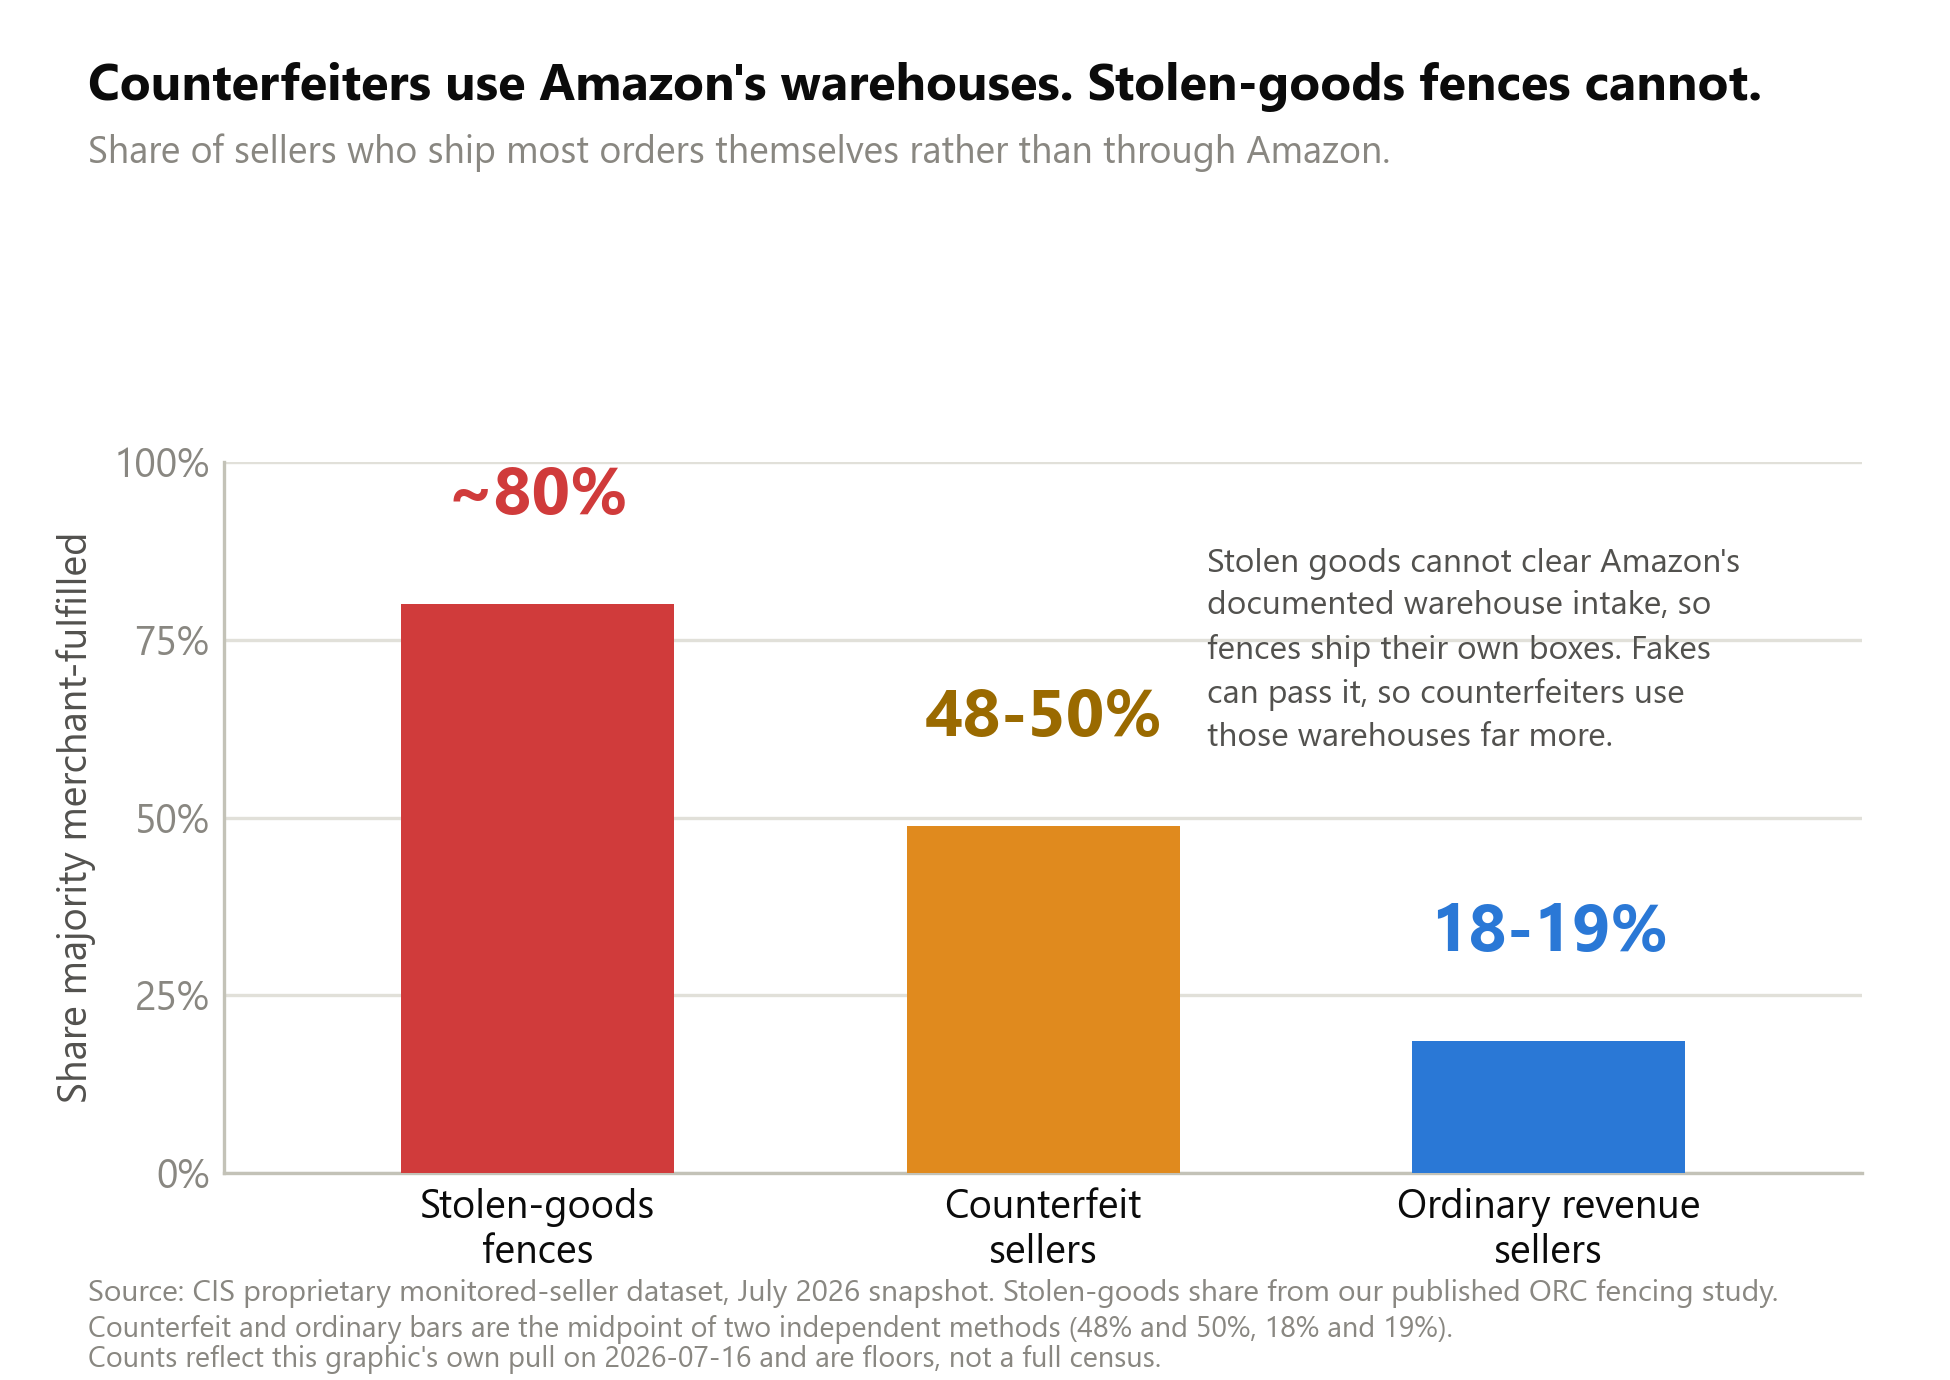
About half of the counterfeit cohort ships its own orders rather than routing them through Amazon’s warehouses. Two independent measurements put the merchant-fulfilled share at 47.8 percent and 49.8 percent. Ordinary revenue-generating sellers sit near 18 to 19 percent. Our published study of stolen-goods fences found that cohort running near 80 percent. The gap is physical. Stolen goods cannot pass Amazon’s documented warehouse intake, so a fence has to ship its own boxes. Mass-produced fakes can pass that intake, so counterfeiters split between the two paths and lean on Amazon’s own warehouses far more than fences do. Half of this cohort is willing to put its product inside Amazon’s building.
Where They Sit
Geography looks like a shell-heavy map. Of the 541, 405 are based in the United States, 136 are foreign, and none were unplaceable. That 25 percent foreign share nearly doubles the fence cohort’s. Among the foreign sellers, 85 percent are Chinese or Hong Kong, 105 from China and 10 from Hong Kong of the 136.
The domestic ranking runs California at 58, Florida at 55, New York at 54, Texas at 44, and New Jersey at 34. Then comes Delaware at 24. The first five are large, populous states, and their placement is unremarkable. Delaware is not. Its population cannot explain a sixth-place finish. A registered-agent and shell-company address can, and the placement is consistent with that reading rather than proof of it.
The Counterfeit Shelf
Map the cohort’s catalog and the safety story starts on its own. The cohort lists 81,534 distinct products, and 88.8 percent of them carry a category, far higher coverage than our stolen-goods study reached.
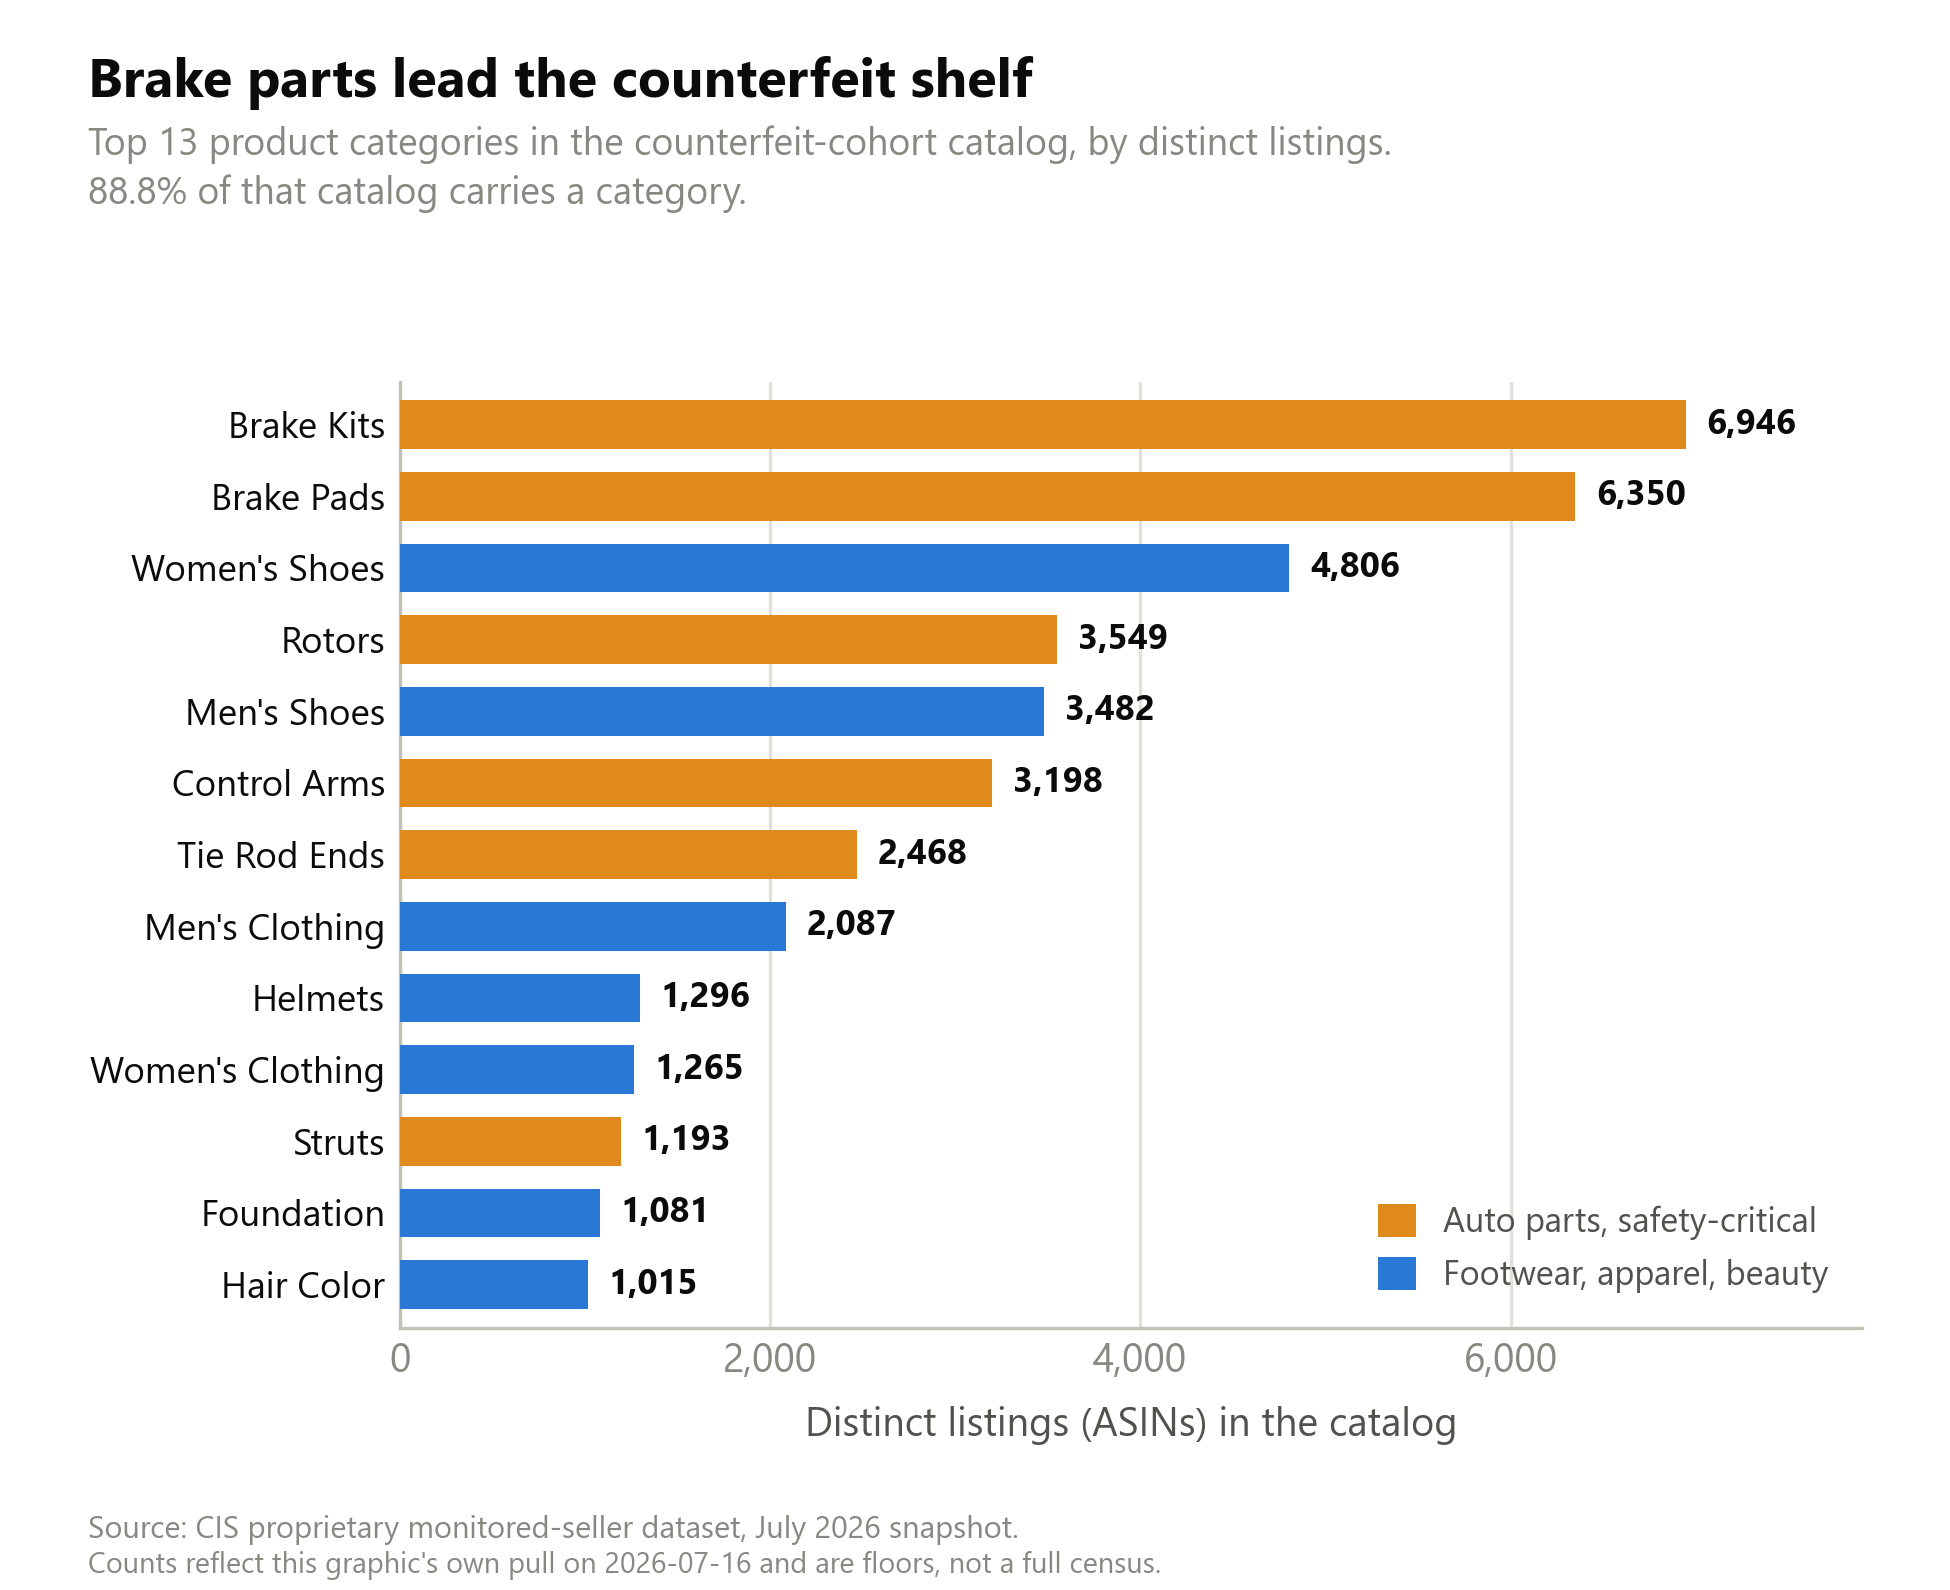
Brake kits top the list at 6,946 listings. Brake pads follow at 6,350. Below them sit women’s shoes, rotors, men’s shoes, control arms, and tie rod ends. Men’s clothing and helmets come next, then beauty goods, foundation at 1,081 listings and hair color at 1,015. Auto parts are the largest single block by volume, carried by a set of about 72 specialist sellers with very large catalogs. Counted a different way, by how many sellers touch a category, drugstore and pharmacy goods reach the most sellers at 336, and beauty follows at 265.
The parts that lead that catalog keep a car on the road and stop it when it has to stop. A counterfeit brake pad is not a knockoff handbag. It is a failure point on a two-ton machine at highway speed. Helmets sit ninth by volume at 1,296 listings, still squarely a life-safety product.
A documentation problem layers on top of the safety problem. About 72.6 percent of the categorized catalog, some 52,559 listings, falls in categories that should carry a manufacturer lot or batch code. A fake in a lot-coded category defeats recall tracing, because there is no genuine batch to trace it back to. Smaller but sharper, 122 listings sit in single-use medical-consumable categories and 58 in patent-dense medical-device categories. Read those two counts as floors. Our trait tags cover only a minority of categories, and this cohort holds little medical inventory to begin with, so the true figures run higher.
They Do Not Go Away
A counterfeit seller that operated once and vanished would be a footnote. This cohort persists.
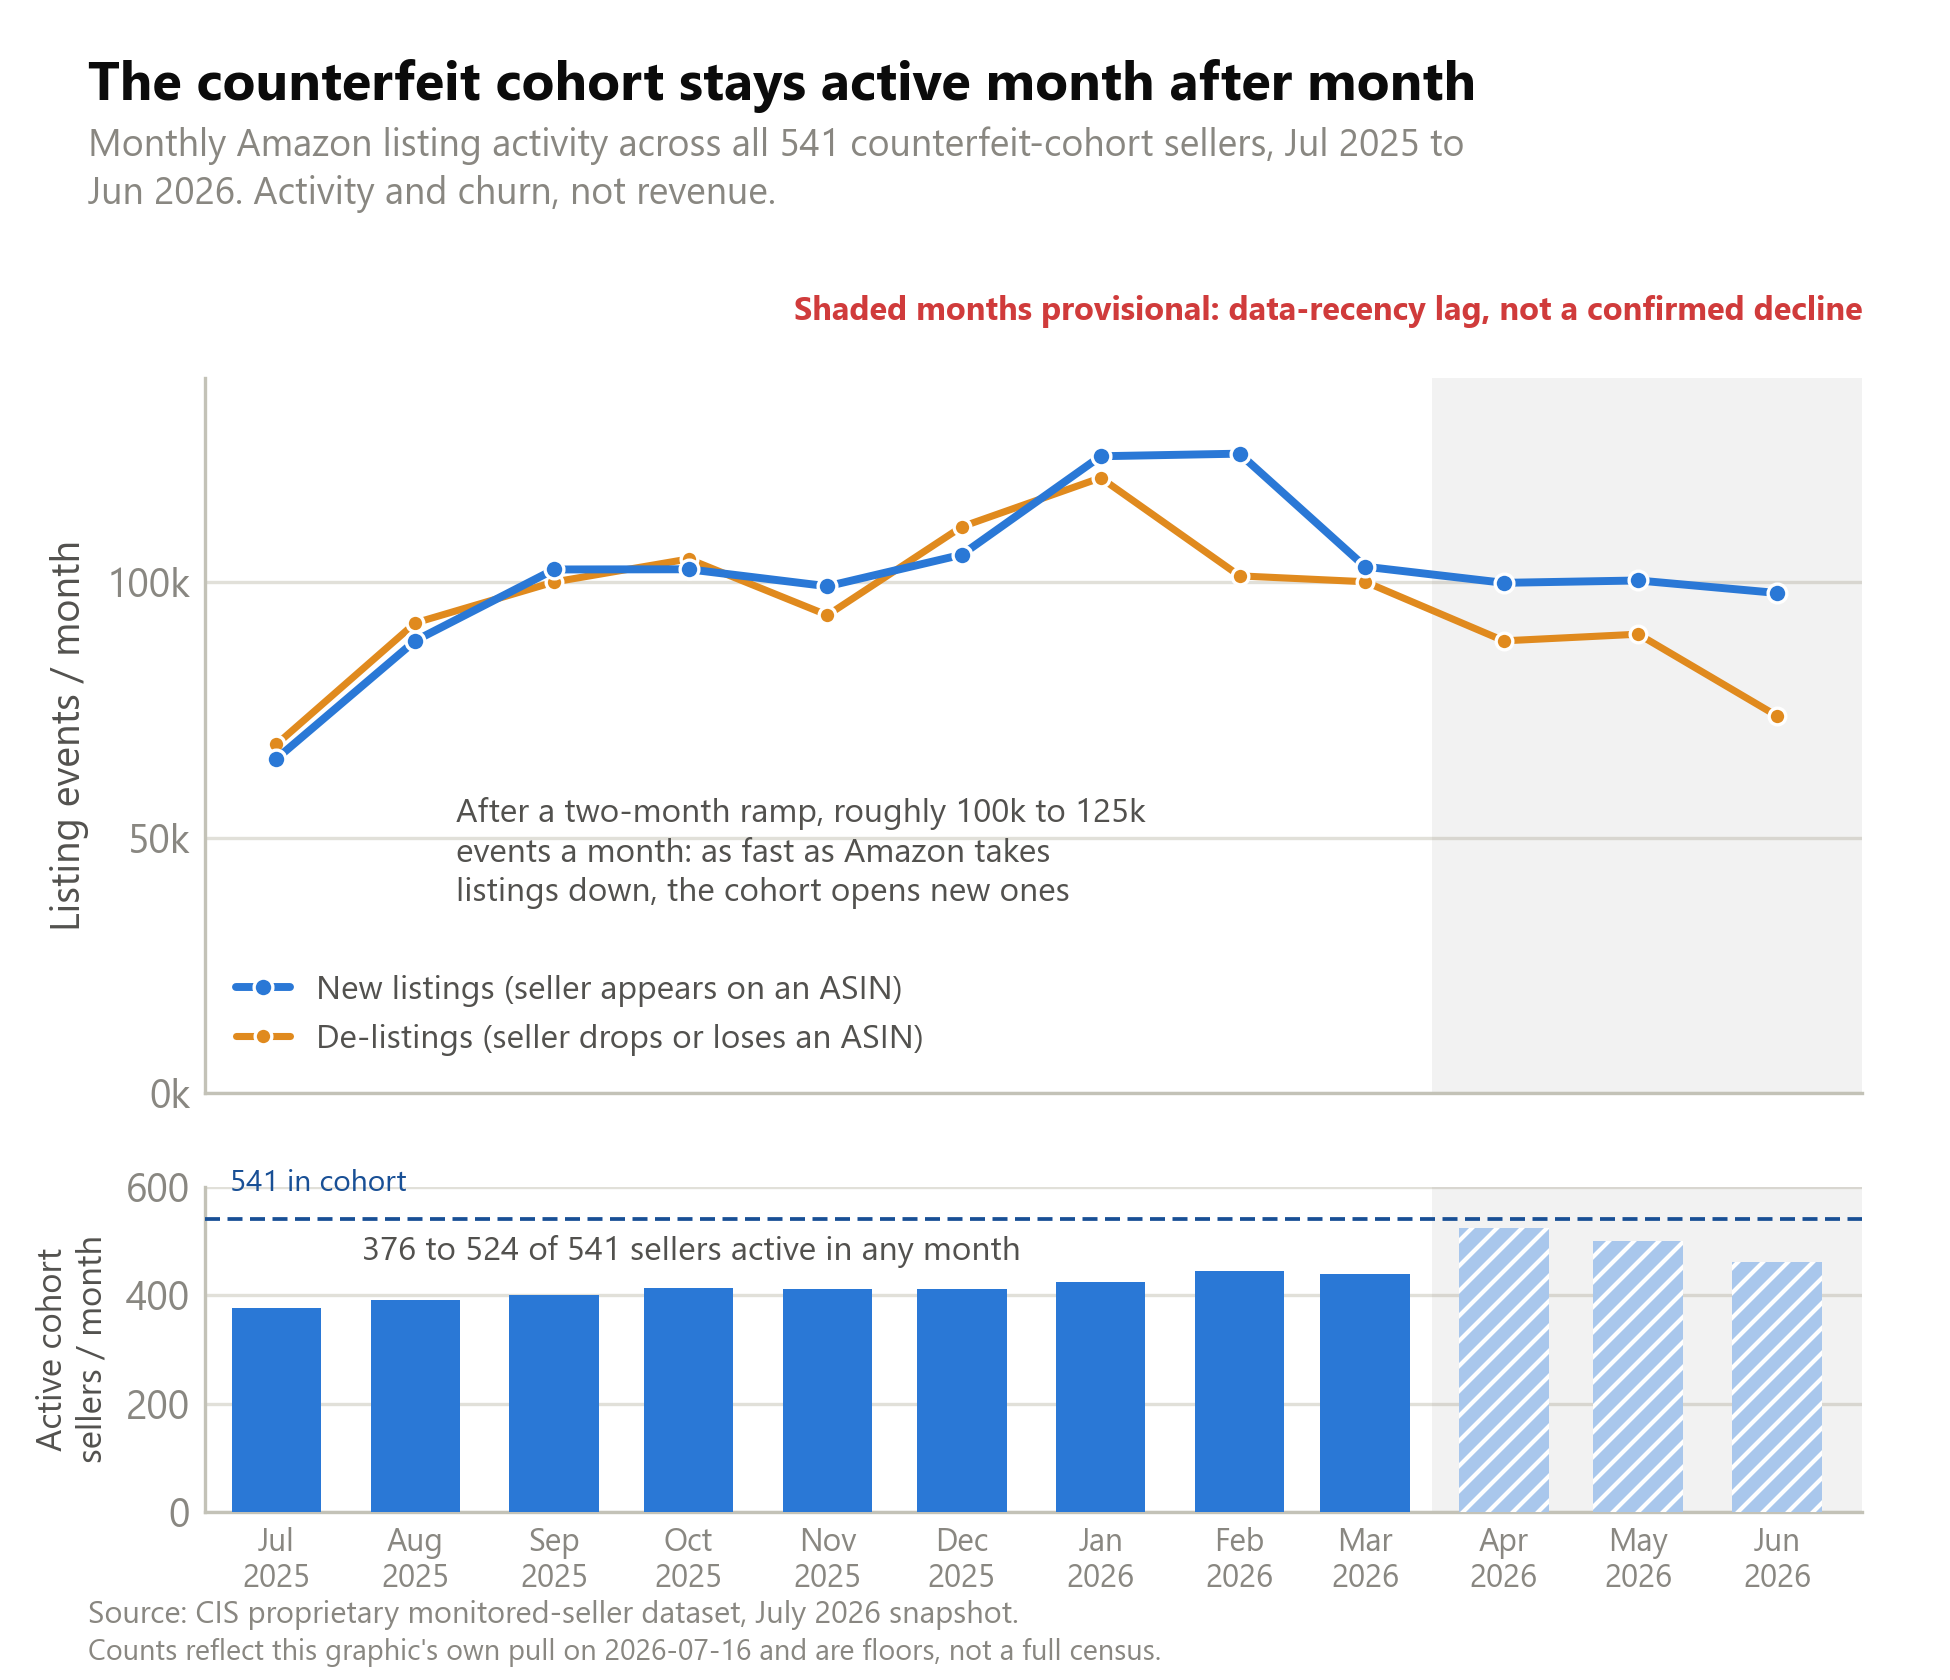
The one honest time series in our data tracks listing activity, meaning listings opened and lost month over month. It measures churn, not dollars, and we label it that way. Listings open at roughly 65,000 in the first tracked month, July 2025, and climb within two months to a plateau near 100,000 to 125,000 a month, with losses tracking at nearly the same rate through June 2026. In any given month, between 376 and 524 of the 541 sellers are active. That is a persistently working population, not a spike, and it runs at roughly ten times the churn of the stolen-goods cohort on much larger catalogs. As fast as listings come down, new ones go up. The most recent months taper, but part of that tail reflects data lag, since fewer refresh cycles have accumulated for the latest weeks. We will not present it as a confirmed decline, because we cannot yet tell contraction from recency.
What a Floor of 541 Implies
Hold onto the word floor. The 541 sellers come from one monitored slice of one marketplace, scored on public behavior alone, with the benefit of the doubt built into every threshold. Sellers we could not clear but could not confirm sit in a separate watchlist we did not count here. The true population on Amazon is larger than 541, and the population across every marketplace is larger still. We will not put a multiplier on that, because an honest floor beats a confident guess.
What the number does establish is the shape of the problem. The counterfeit side of the marketplace is not a fringe of tiny operators. It is a population of real businesses. Half of them ship through Amazon’s own warehouses. A quarter are offshore and overwhelmingly Chinese, stocking brakes, helmets, and other goods a person’s safety depends on. They churn tens of thousands of listings a month and keep coming back. The doubt that rides along with an online purchase is not paranoia. It is a rational read of a marketplace where a measurable population sells fakes for a living and does not stop when a listing comes down.
A Note on Method
This study rests on public marketplace behavior across roughly 84,000 Amazon sellers under CIS monitoring, not on inside access to Amazon or to seller financials. The 541-seller figure is a classification of behavior, not a finding of guilt against any individual. Every count is a floor as of the July 16, 2026 snapshot, and the classification re-scores continually, so the numbers drift. Revenue figures are snapshot estimates, reported as medians only, computed over the 421 sellers that carry an estimate, with the 79 blank and 41 zero denominators stated alongside. Those estimates read low for a structural reason. Public trackers credit a listing’s sales to whoever holds Amazon’s Featured Offer, sampled at one moment and from one regional vantage. Since 2023 Amazon has filled U.S. orders through eight largely self-sufficient regional networks, so one vantage misses the winners in other regions. In our casework, when a seller’s own records surface later, the real volume runs above the public estimate, not below it. Category counts cover the 88.8 percent of the catalog we could map. The lot-code and medical counts are floors on top of that, since our trait tags reach only a minority of categories. The activity series measures listing churn, not revenue, and its most recent months are affected by data lag. Prosecution, seizure, and trade figures come from federal court records and official government and intergovernmental releases. Amazon’s Brand Protection Report figures are the company’s own claims and are labeled as such. We name no seller from our own data, because classification is not adjudication.
Sources
- U.S. Customs and Border Protection, IPR Seizure Statistics FY2024: https://www.cbp.gov/trade/priority-issues/ipr/statistics
- OECD/EUIPO, Mapping Global Trade in Fakes 2025: https://www.oecd.org
- U.S. Department of Homeland Security, Combating Trafficking in Counterfeit and Pirated Goods (January 2020): https://www.dhs.gov
- U.S. Government Accountability Office, GAO-18-216 (2018), third-party marketplace counterfeit testing: https://www.gao.gov/products/gao-18-216
- Amazon, Brand Protection Report 2024 (figures cited as Amazon’s own claims): https://www.aboutamazon.com
- Amazon Science, U.S. fulfillment network restructured into eight largely self-sufficient regional networks: https://www.amazon.science/news-and-features/how-amazon-reworked-its-fulfillment-network-to-meet-customer-demand
- Feedvisor, “Amazon Buy Box,” industry estimate of the Featured Offer’s share of sales (flagged by the source as an estimate): https://feedvisor.com/university/amazon-buy-box/
- Federal Trade Commission v. Amazon (2023), as reported on the share of sales flowing through the featured position: https://www.ibtimes.co.uk/amazon-price-manipulation-antitrust-cases-1808773
- CIS proprietary monitored-seller dataset, July 2026 snapshot. Keepa historical marketplace data.
About Cyber Investigation Services
Cyber Investigation Services is a licensed private investigation firm with 16 years of work in ecommerce crime. The firm builds intelligence on counterfeit, stolen, and diverted goods moving through online marketplaces, and works with brands and law enforcement to act on it.