ResearchORC series, Part 3
How Retailers Can Squeeze ORC From the Fence Side
Turning the Fence's Own Evidence Against It: Part 3 of a Series on Organized Retail Crime's Online Fences
The Side Nobody Works
Almost everything built to fight organized retail crime points at two places. The thief, and the store that gets robbed. State task forces investigate boosting crews. Felony-threshold laws set the dollar line that turns shoplifting into a chargeable offense. The regional organized-retail-crime associations coordinate stores and police against the people lifting goods off shelves. Loss-prevention staffing sits inside the store, watching the door and the aisle.
Read the government record and the same shape appears. The Congressional Research Service noted in 2024 that combating retail theft “has primarily been handled by state and local law enforcement under state criminal laws,” keyed to the theft event and its dollar value. The one demand-side lever named in that literature is generic, the idea that online marketplaces should be regulated because they make reselling stolen goods easier. Everything concrete sits on the supply side. The fence, the node where stolen goods actually turn into money, is worked least of all.
That is backwards. The fence is the better target, and the reasons are not opinion.
Why the Fence Is the Better Target
Start with the economics. In 2011 the Government Accountability Office found that online fencing returns “70 percent or more of the retail value of the product versus approximately 30 percent through traditional fencing venues.” Part 1 used that number to explain why the fence moved online. It also explains why the fence is worth pursuing. The money concentrates at the resale node. A booster earns pennies on the dollar. The fence keeps most of the retail value, which makes the fence the point where proceeds pool and where the operation is most exposed.
The fence is also frequently the organizer, not a passive buyer at the end of the chain. The Congressional Research Service put it plainly in 2012. Boosters “often carry ‘fence sheets,’ or shopping lists provided to boosters by fences.” The theft is directed from the resale side. At a 2023 House Judiciary hearing, Kansas Attorney General Kris Kobach described the same arrangement, saying boosters “are given assignments by the fence, what to go steal next, where to steal it.” Court records show it in practice. Michelle Mack, the California operator Part 1 described, paid the travel and directed the crews who hit more than 200 stores for her. The Rubinov network in New York ran managers who directed boosters.
One fence also concentrates the output of many boosters. The Florida case of Robert and Jaclyn Dell shows the funnel. Their boosters hit Home Depot stores five and six times a day across seven counties, and the goods flowed into a single eBay store. Arrest a booster and the fence keeps buying from the next one. Take the fence and the whole downstream collapses. That is the choke point the current playbook mostly skips.
The Shape of the Fencing Side
The fencing side is not one kind of operation. It runs from a lone seller to a coordinated organization, the same span Part 1 drew across three prosecuted cases. Our data now shows that span at population scale.
Of the roughly 500 sellers our classification currently flags, 521 at the time of this analysis, most stand alone. 423 are solo. But 98 sit inside multi-seller groups whose catalogs overlap so heavily they behave as one distribution network. We count 37 such groups. 28 of them lean toward stolen goods rather than counterfeit, and together those 28 pool an estimated $12.8 million in monthly revenue.
Here is the finding that should change how a loss-prevention team reads a marketplace. A large fencing organization does not show up as a large seller. It shows up as a crowd of small, unremarkable accounts.
The numbers make the point against intuition. A grouped seller in our data is individually smaller than a solo one. Median peak monthly revenue for grouped sellers is $2,657, against $3,962 for solos. The scale does not live in any single account. It lives in the pool. The largest stolen-leaning organization we found is a cluster of 43 storefronts hubbed in Florida, most of them modest on their own, together moving an estimated $6.69 million a month across a shared catalog that is roughly three-quarters stolen-leaning.
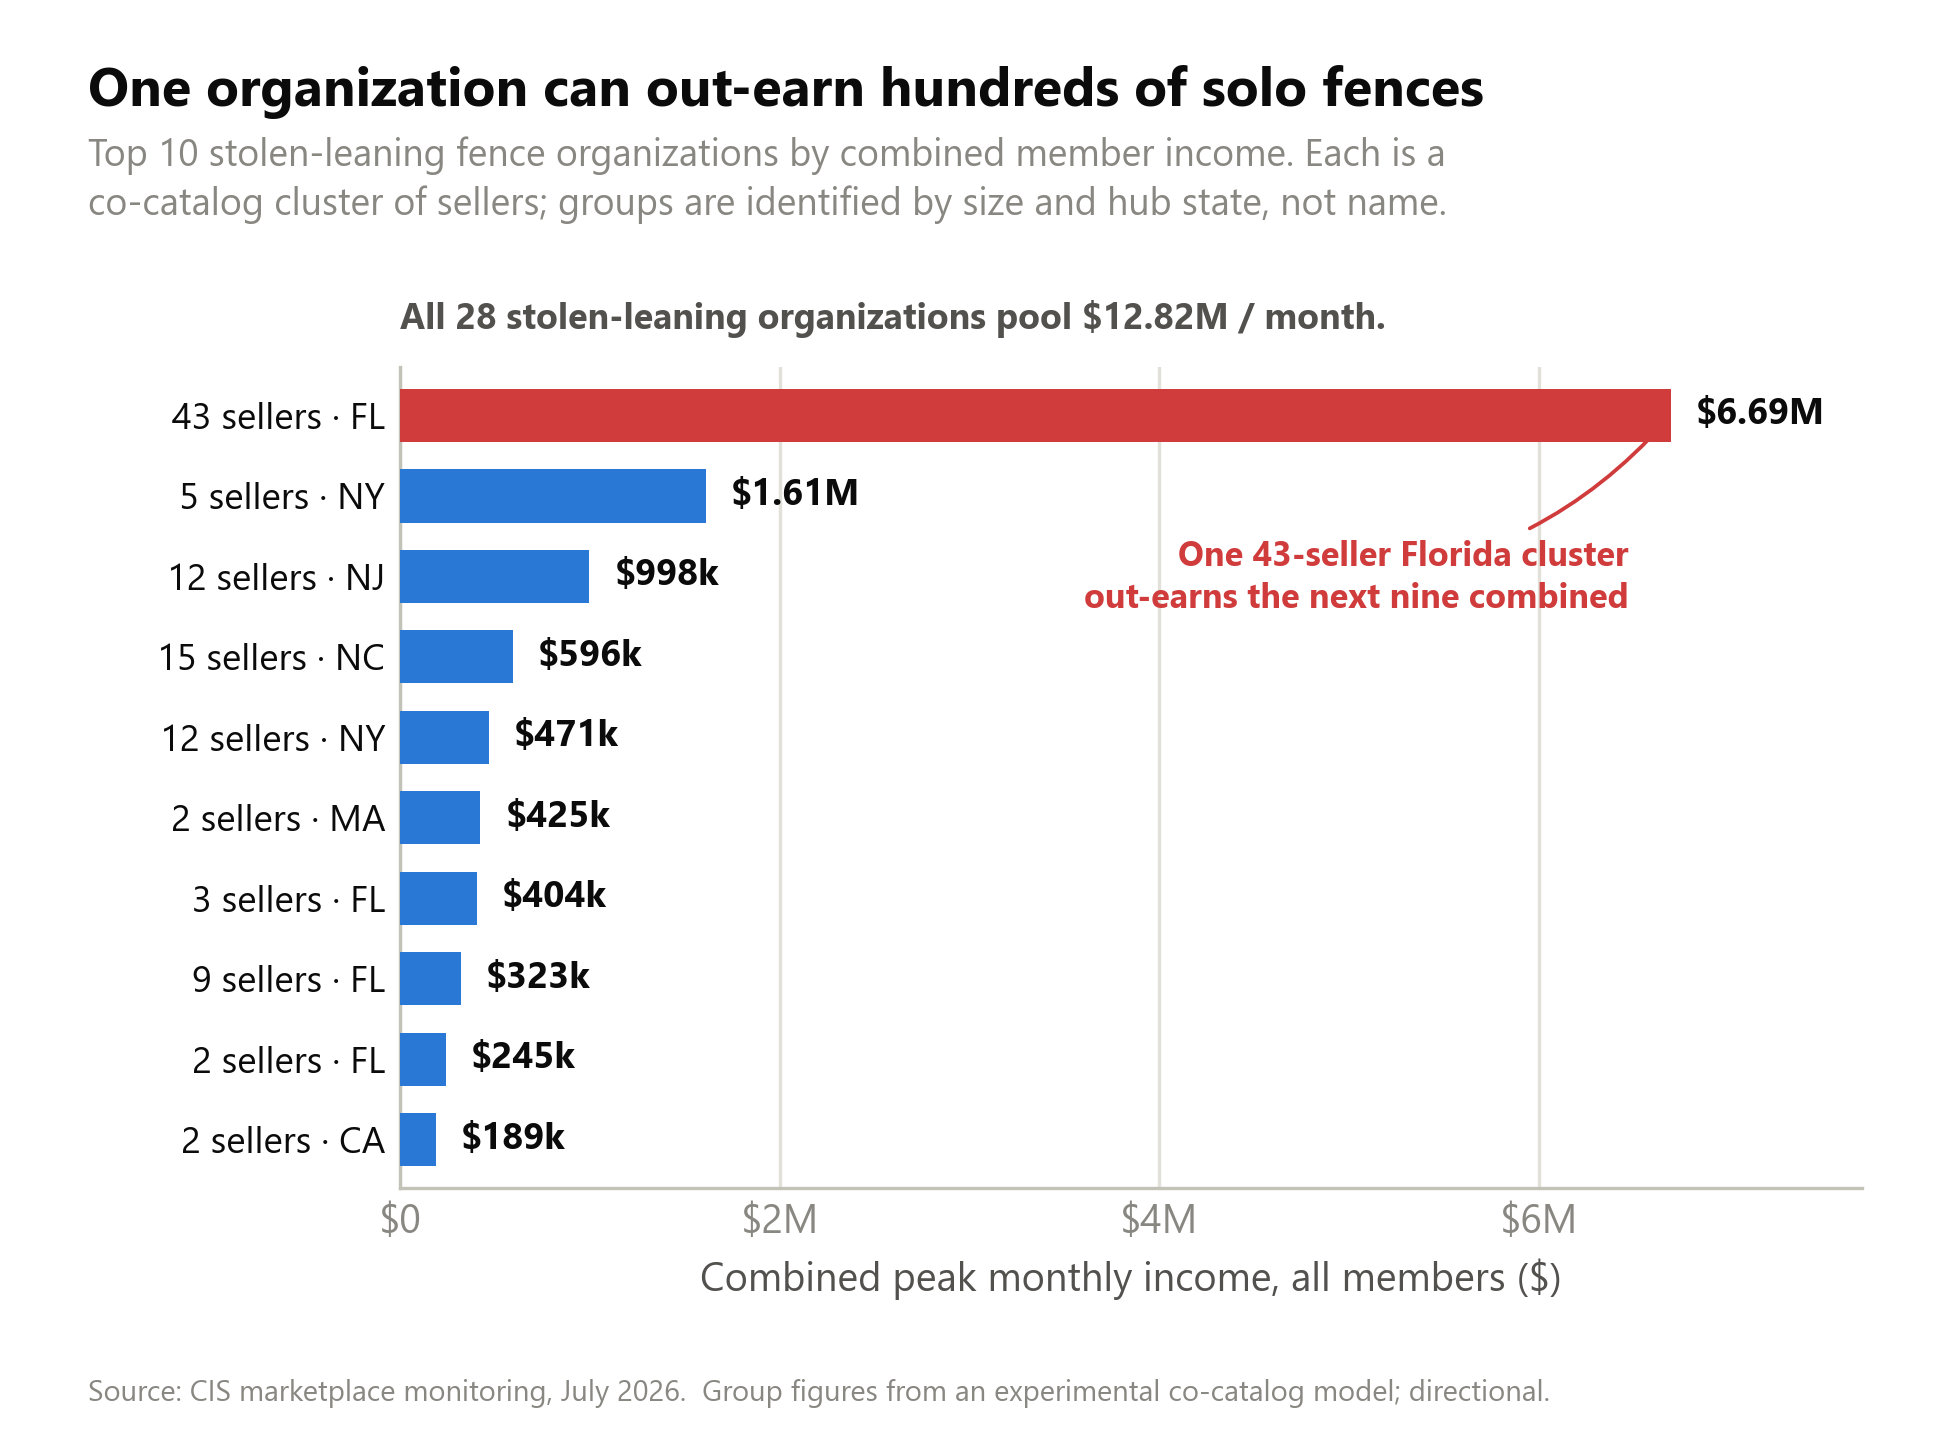
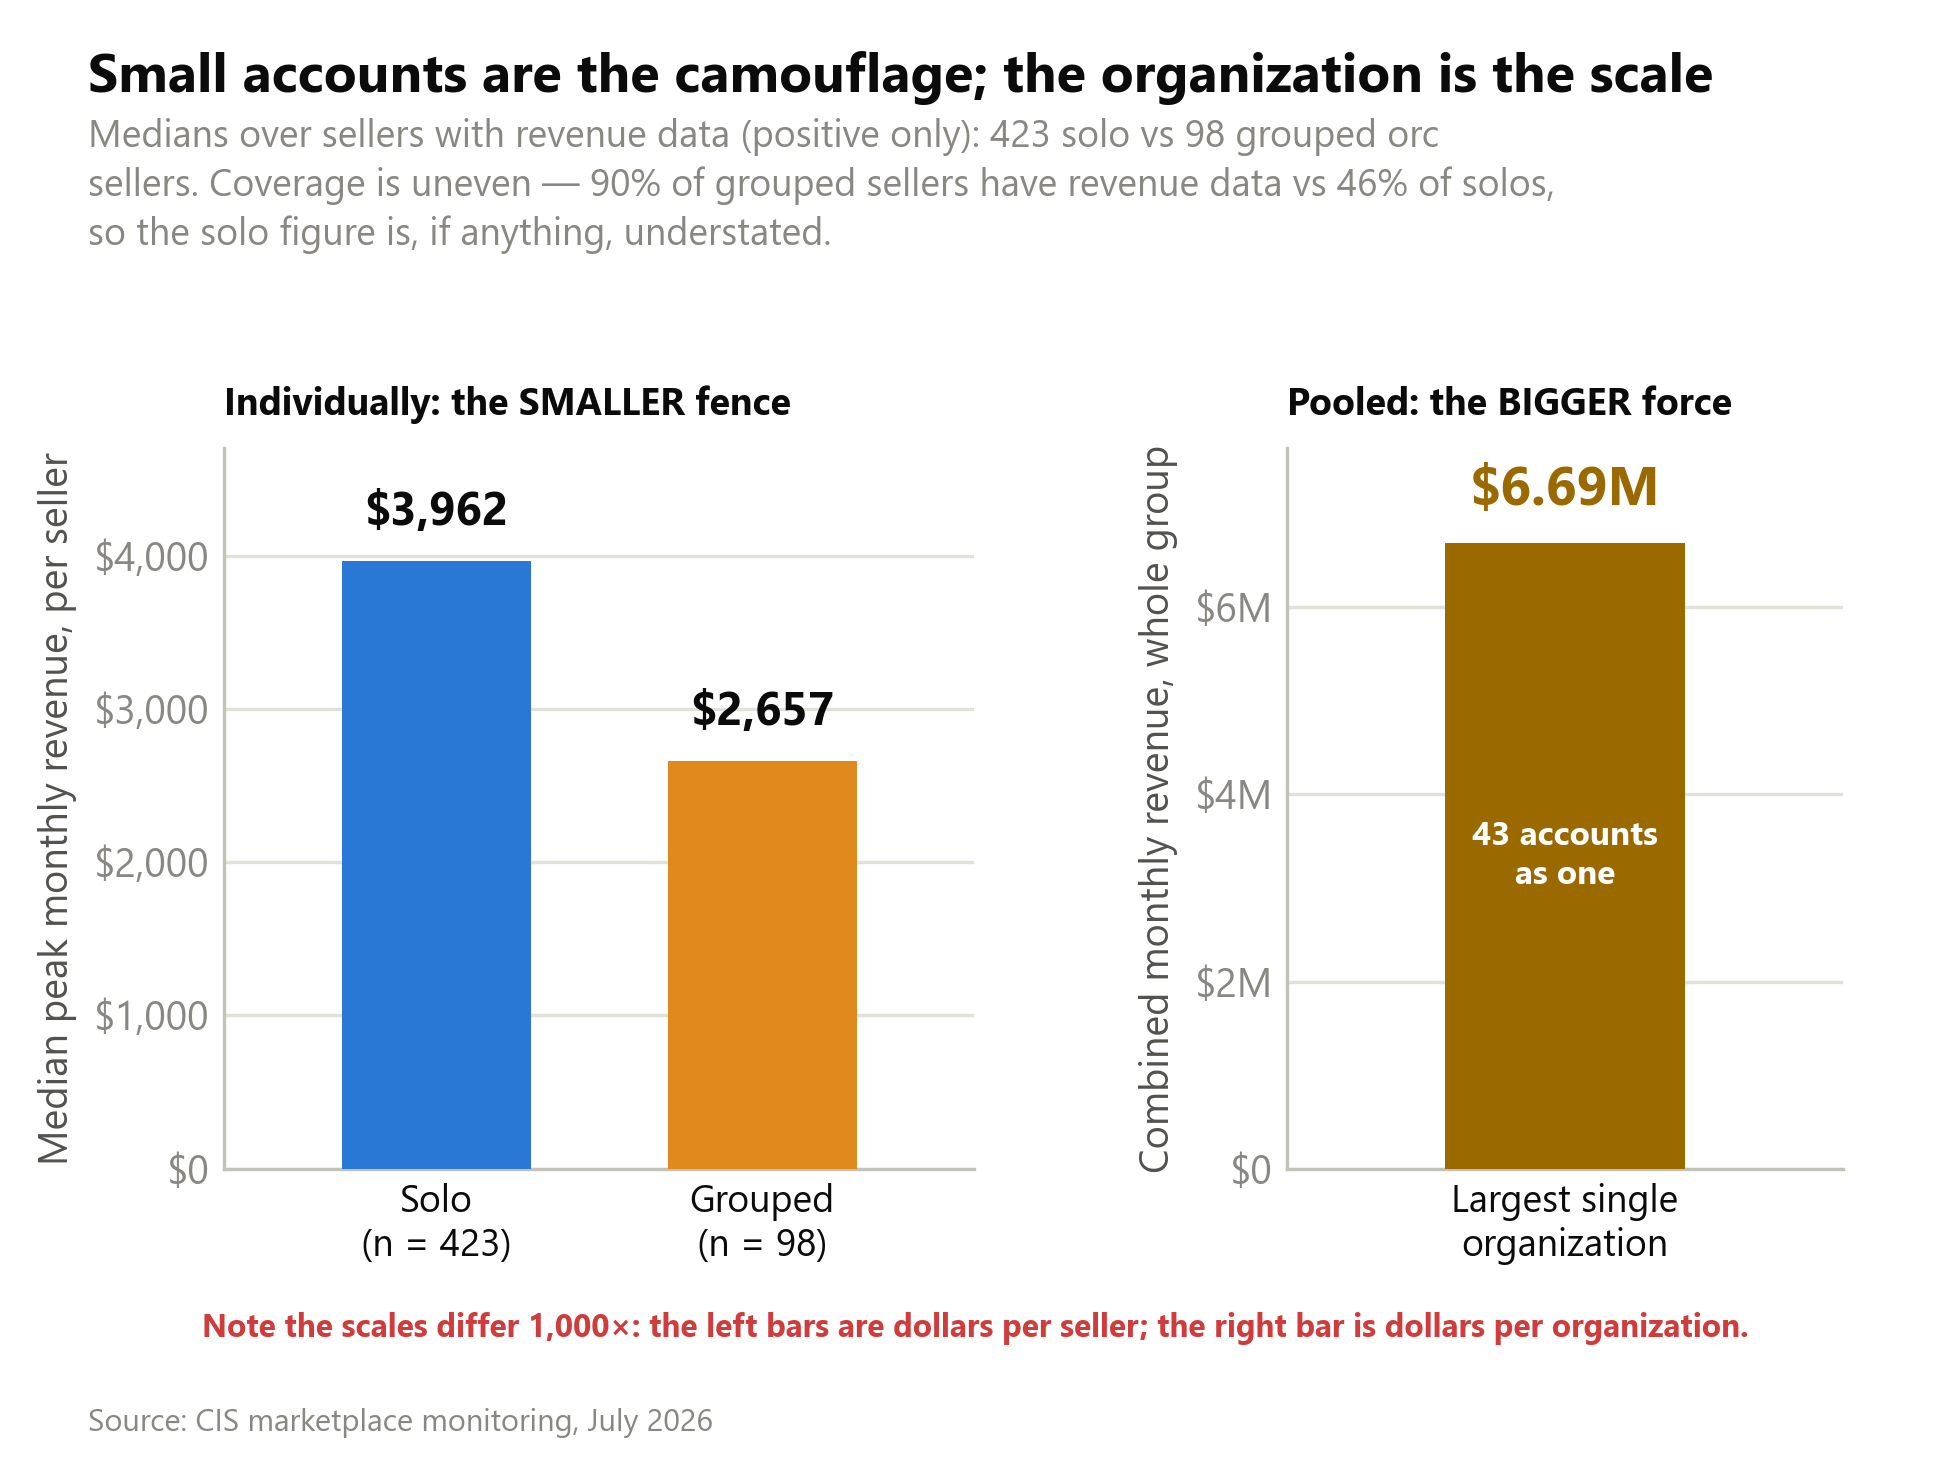
This is distribution protection, deliberate in effect whether or not by design. Spread the operation across many small accounts and no single suspension or arrest slows it down. Amazon freezes one storefront and the other 42 keep selling. A booster gets arrested and the catalog reappears under an account no one named. The takedown math only works when you can see the group as one organization instead of 43 separate small fry.
Two honesty notes belong here. Solo sellers still hold more total revenue in our data than grouped ones, $2.21 million against $1.03 million of measured peaks, so this is a story about structure and resilience, not about groups being richer. And revenue coverage is uneven, with 90 percent of grouped sellers carrying a revenue estimate against 46 percent of solos, which if anything understates the solo side. The organization’s advantage is not size. It is the way it hides size.
A second lens, built a different way, points the same direction. Alongside the catalog-overlap groups, we track co-stranding networks, sellers linked because their listings are frozen together in the pattern Part 2 described. Of 52 such networks, 40 have three or more members, and the largest reaches 11. Two methods that share no inputs both find a fencing side made mostly of organized structures, not lone pairs. The one caveat is scope. These networks are seeded from high-revenue watchlist sellers and expanded only two steps out, so they undercount the smaller and deeper structures rather than overstate them.
Organizations exist on the counterfeit side too, and the largest we see there is a 69-seller California cluster moving an estimated $3.04 million a month, but counterfeit is a different problem for a different article.
The Complainant Problem, and the Data That Breaks It
Even a well-documented fence often goes unprosecuted, and the reason is structural. Someone has to say the goods are theirs.
There is no federal statute against organized retail crime, as the Congressional Research Service confirmed in 2024. Cases get built under general theft and trafficking laws, at the state and county level, against a dollar threshold. Kobach described a $250,000 threshold in his area, below which “you’re not going to get your case prosecuted.” He named the capacity limit too. “If you’ve got multiple stores getting hit multiple times each day, they don’t have the capacity to investigate all of them.” And the internet erases the last thread. At the same hearing, Representative Sheila Jackson Lee observed that “the anonymous nature of the internet has made it easier for criminals supporting the activities and resale of their ill-gotten merchandise.”
Put those together and you get a chicken-and-egg trap. No single retailer knows a given fence is selling its stolen goods, so no one files the complaint, so no case gets built. The stolen product resells anonymously to a stranger, and the victim never learns it was victimized.
Two datasets break that trap, and neither does it alone.
Start with what the fence puts in public view. What a seller lists tells you which kind of store its goods come from. We mapped each classified seller’s listings back to the retail channel behind the products, and where the data exists the signal is sharp. Among the 325 sellers we could categorize, 309, or 95 percent, draw at least 60 percent of their categorized listings from a single retail channel. For 210 of them a single channel accounts for everything we can see. The median dominant share is 100 percent. Drugstore and pharmacy leads at 291 sellers, then mass-merchant at 223 and beauty-specialty at 140.
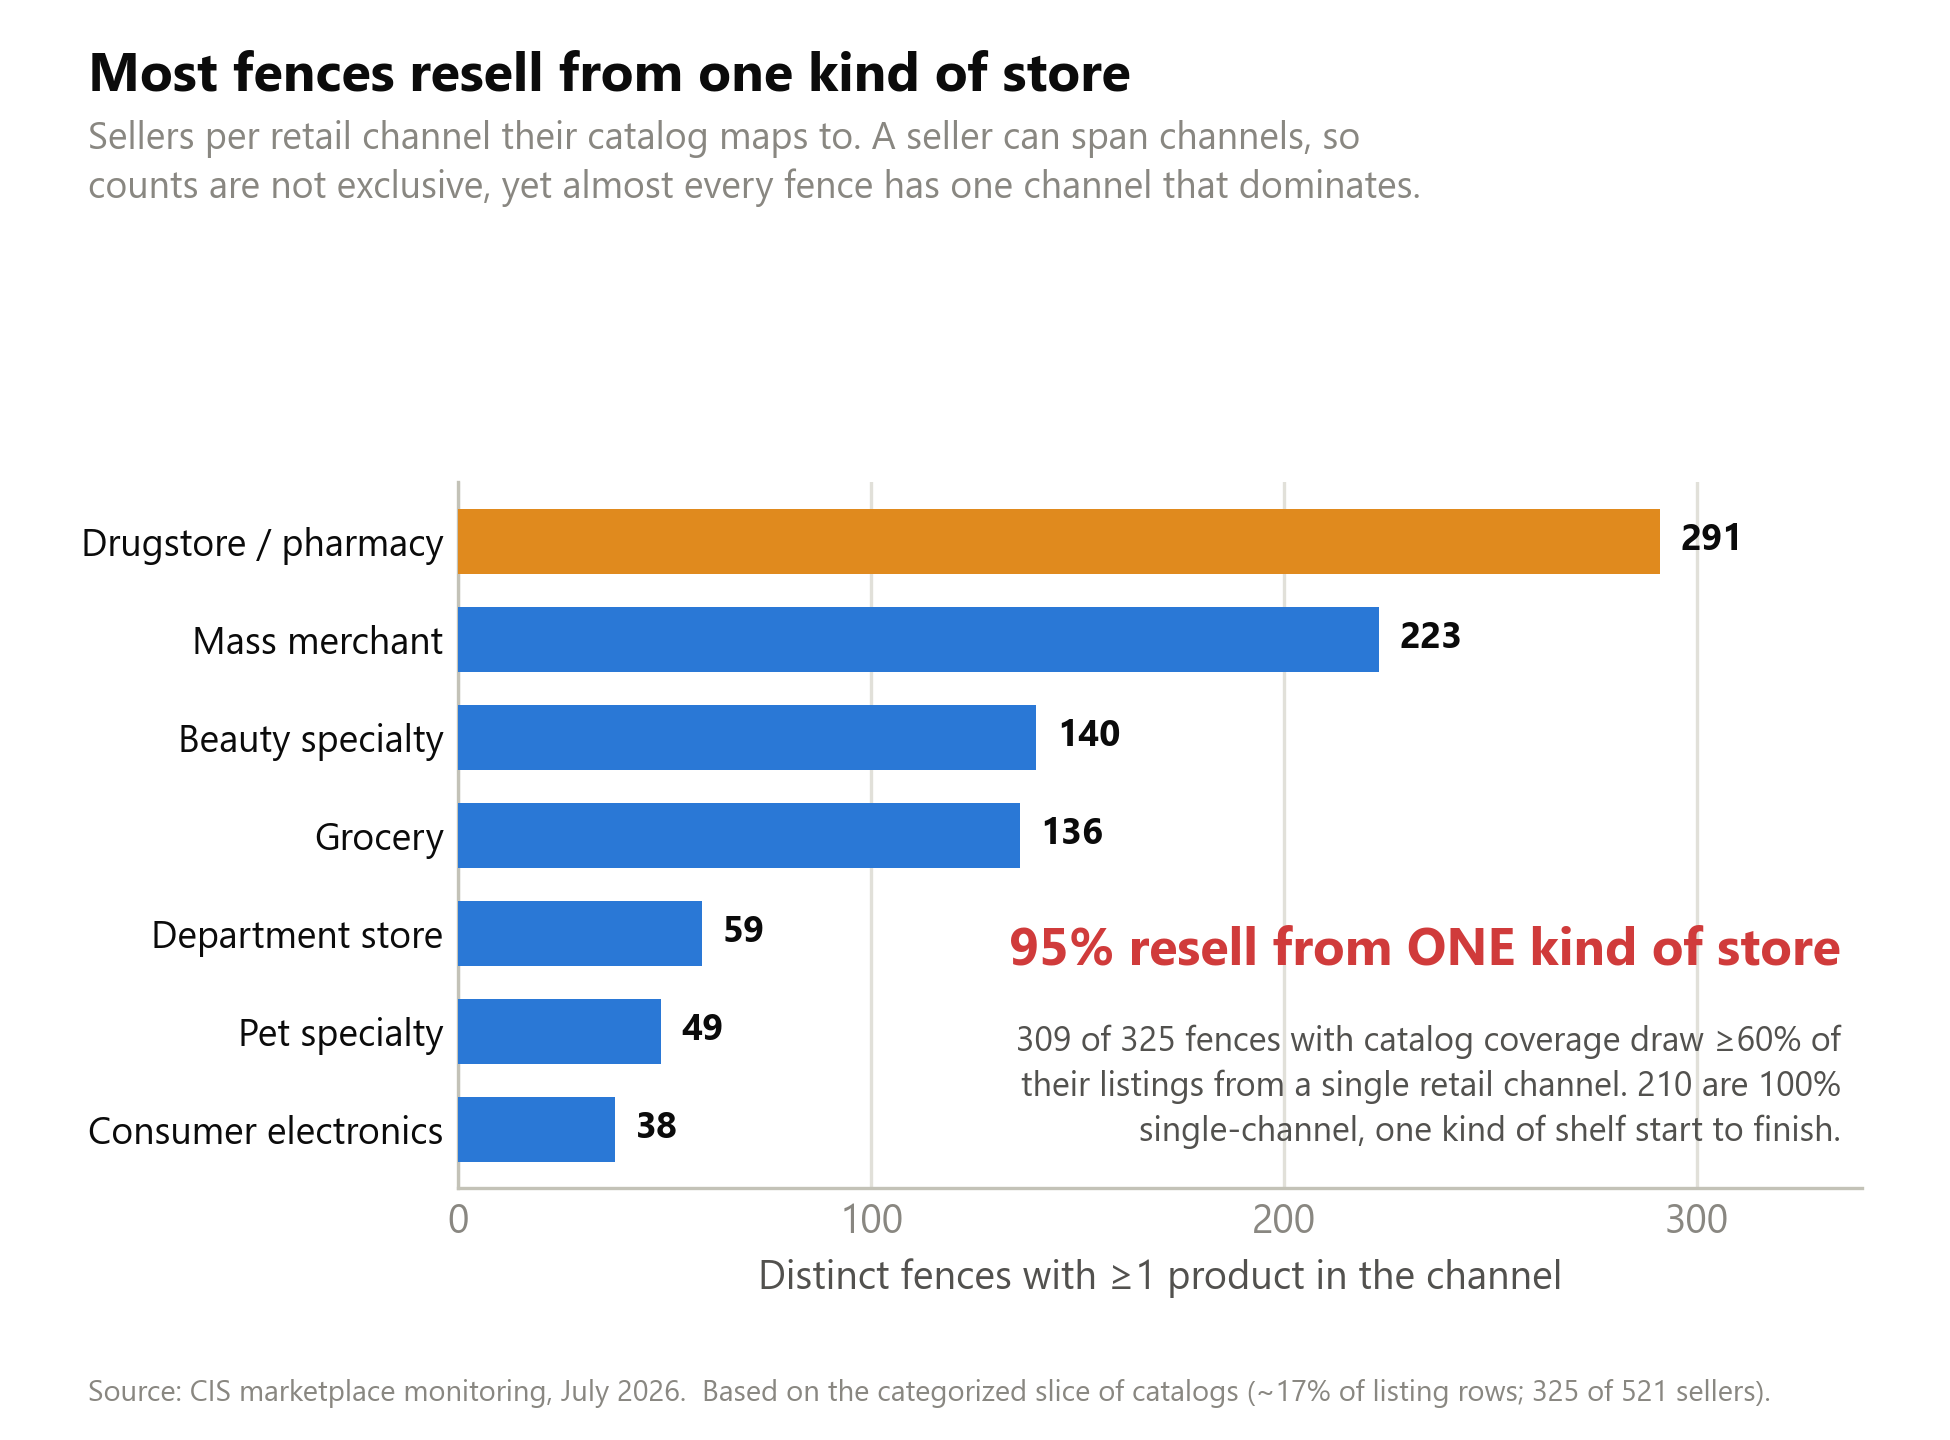
That narrows the field without naming a defendant. A catalog that is overwhelmingly drugstore consumables tells you the goods came off a drugstore shelf, but not which chain, because several chains stock the same aisle and marketplace data cannot sort one from another. Our data hands a loss-prevention team a channel, not a name. The fence is moving drugstore-shelf goods. Which drugstore it is, the public record cannot say.
The retailer’s own loss data closes it. A chain knows what walked out of its stores in detail: the item, the quantity, the location, the date and time, and the manufacturer lot number on the package. Join that against the fence catalogs and listing timelines we already hold, and the picture turns from a channel into a map of which sellers are moving which thefts. We keep the mechanics of that match to ourselves, because the operators read too, but the output is what matters. A drugstore that shares its loss records stops being one of several possible victims and becomes the named complainant on a specific fence.
A small number of evidence purchases then settles it. Buy a few units from the mapped seller and one of two things comes back. Either the manufacturer lot numbers match the lots the retailer reported stolen, or the numbers have been scratched off and defaced. Each pushes confidence the same way. A matching lot ties the goods to the theft. Scratched-off numbers are consciousness of concealment, an admission on the package that someone did not want it traced. Both give law enforcement footing to act. These drugstore and health-and-beauty products carry manufacturer lot codes as a rule, which is what makes the lot match viable for this cohort.
The complainant problem runs in reverse once the two datasets meet. The public catalog names the channel, the loss records name the victim, and a handful of buys turns a high-probability map into goods you can hold.
The caveat is real and worth stating in the same breath. The channel mapping rests on a partial view. Only about 17 percent of the cohort’s catalog rows carry a category we can map, 325 of 521 sellers have any coverage at all, and the median covered seller offers just five categorized listings. The direction is strong and consistent. The precision comes from the join, not from the catalog alone.
The Escalation Ladder
Not every fence belongs in the same court. The structure in the data suggests where each kind should go.
Small and local operators are state cases. The precedents already exist, and Parts 1 and 2 named them. Rubinov was a New York Attorney General prosecution. The Dell ring was charged by the Florida Attorney General. Michelle Mack was a California case. A solo seller reselling one region’s stolen drugstore goods fits the state channel that already handles this crime under general theft law.
Organizations change the calculus. When the pattern shows many coordinated accounts with transnational ties and money laundering, it belongs at the federal level. Homeland Security Investigations built Operation Boiling Point for exactly this, its response to organized theft groups profiting from retail and cargo theft that threatens the wider economy. The laundering scale is the reason. A 2022 assessment by HSI and ACAMS estimated that organized theft groups launder roughly $69 billion through trade-based money laundering. The direction is not new. As far back as 2008, a FinCEN case example documented the same pattern. A grocer helped five retail-theft rings launder at least $69 million from stolen baby formula and health-and-beauty products, and the conviction turned on bank records. The dividing line up the ladder is not the theft. It is cross-border movement and laundering.
The transnational thread is not rare at the top of the market. In 2025 the National Retail Federation and its research partners reported that 67 percent of retailers saw transnational involvement in the organized theft they faced. The largest fencing organizations are not local nuisances. They are nodes in cross-border supply chains, which is precisely why the biggest ones outgrow the state courts.
The Playbook
For a retailer or brand sitting on theft data and watching the losses climb, the fence side offers concrete moves. None of them require inside access to a marketplace. Parts 1 and 2 proved the public record is enough.
Treat the fence as an intelligence target, not only the booster as an arrest target. The booster is replaceable. The fence is the fixed point where goods and money converge.
Work the public marketplace record. Listing histories and the catalog itself are open, and the first two parts of this series showed they carry enough signal to build a picture before a subpoena is ever drafted.
Share your loss data. You know what left your stores, in what quantity, from which location, when, and under which lot numbers. Handed to an investigator holding the fence catalogs, that record turns a channel into a named suspect, and it is the one input the public marketplace cannot supply.
Fund the buys that close it. Once the map points at specific sellers, a small run of evidence purchases either recovers your stolen lot numbers or recovers units with the numbers scratched off. Either result is something a prosecutor can move on, and it takes a handful of orders rather than a task force.
Route by structure. A lone local seller is a referral to a state task force or attorney general. A coordinated group with cross-border movement is a federal matter for HSI. Sending an organizational case to a county desk wastes it, and sending a solo seller to a federal one rarely clears the bar.
Support marketplace-side verification. The INFORM Consumers Act already forces high-volume sellers to identify themselves, and pushing marketplaces to enforce it hard is the one lever that raises the cost of hiding behind a screen.
What Changes When the Industry Moves Together
One retailer doing this closes cases one at a time. Each case is real, and each is local. One complainant, one fence, one map. The fence across the aisle keeps operating, because its victim has not looked yet.
Run the same method across the chains that ORC hits and the arithmetic flips. Pooled loss data does not add coverage, it multiplies it. Every fence’s dominant channel now has a victim who can name it. A seller weighing a load of stolen inventory can no longer ask whether one particular chain is watching, because any unit on the shelf could carry the lot number that gets the account mapped, bought, and referred. A channel that was safe at any volume becomes unsafe at every volume. Retail has coordinated on the booster side for years through the regional crime associations. The same cooperation, pointed at the fence, is the game changer, because it attacks the one thing every fencing operation needs and no fencing operation can hide: the goods themselves.
The Fence Was Visible All Along
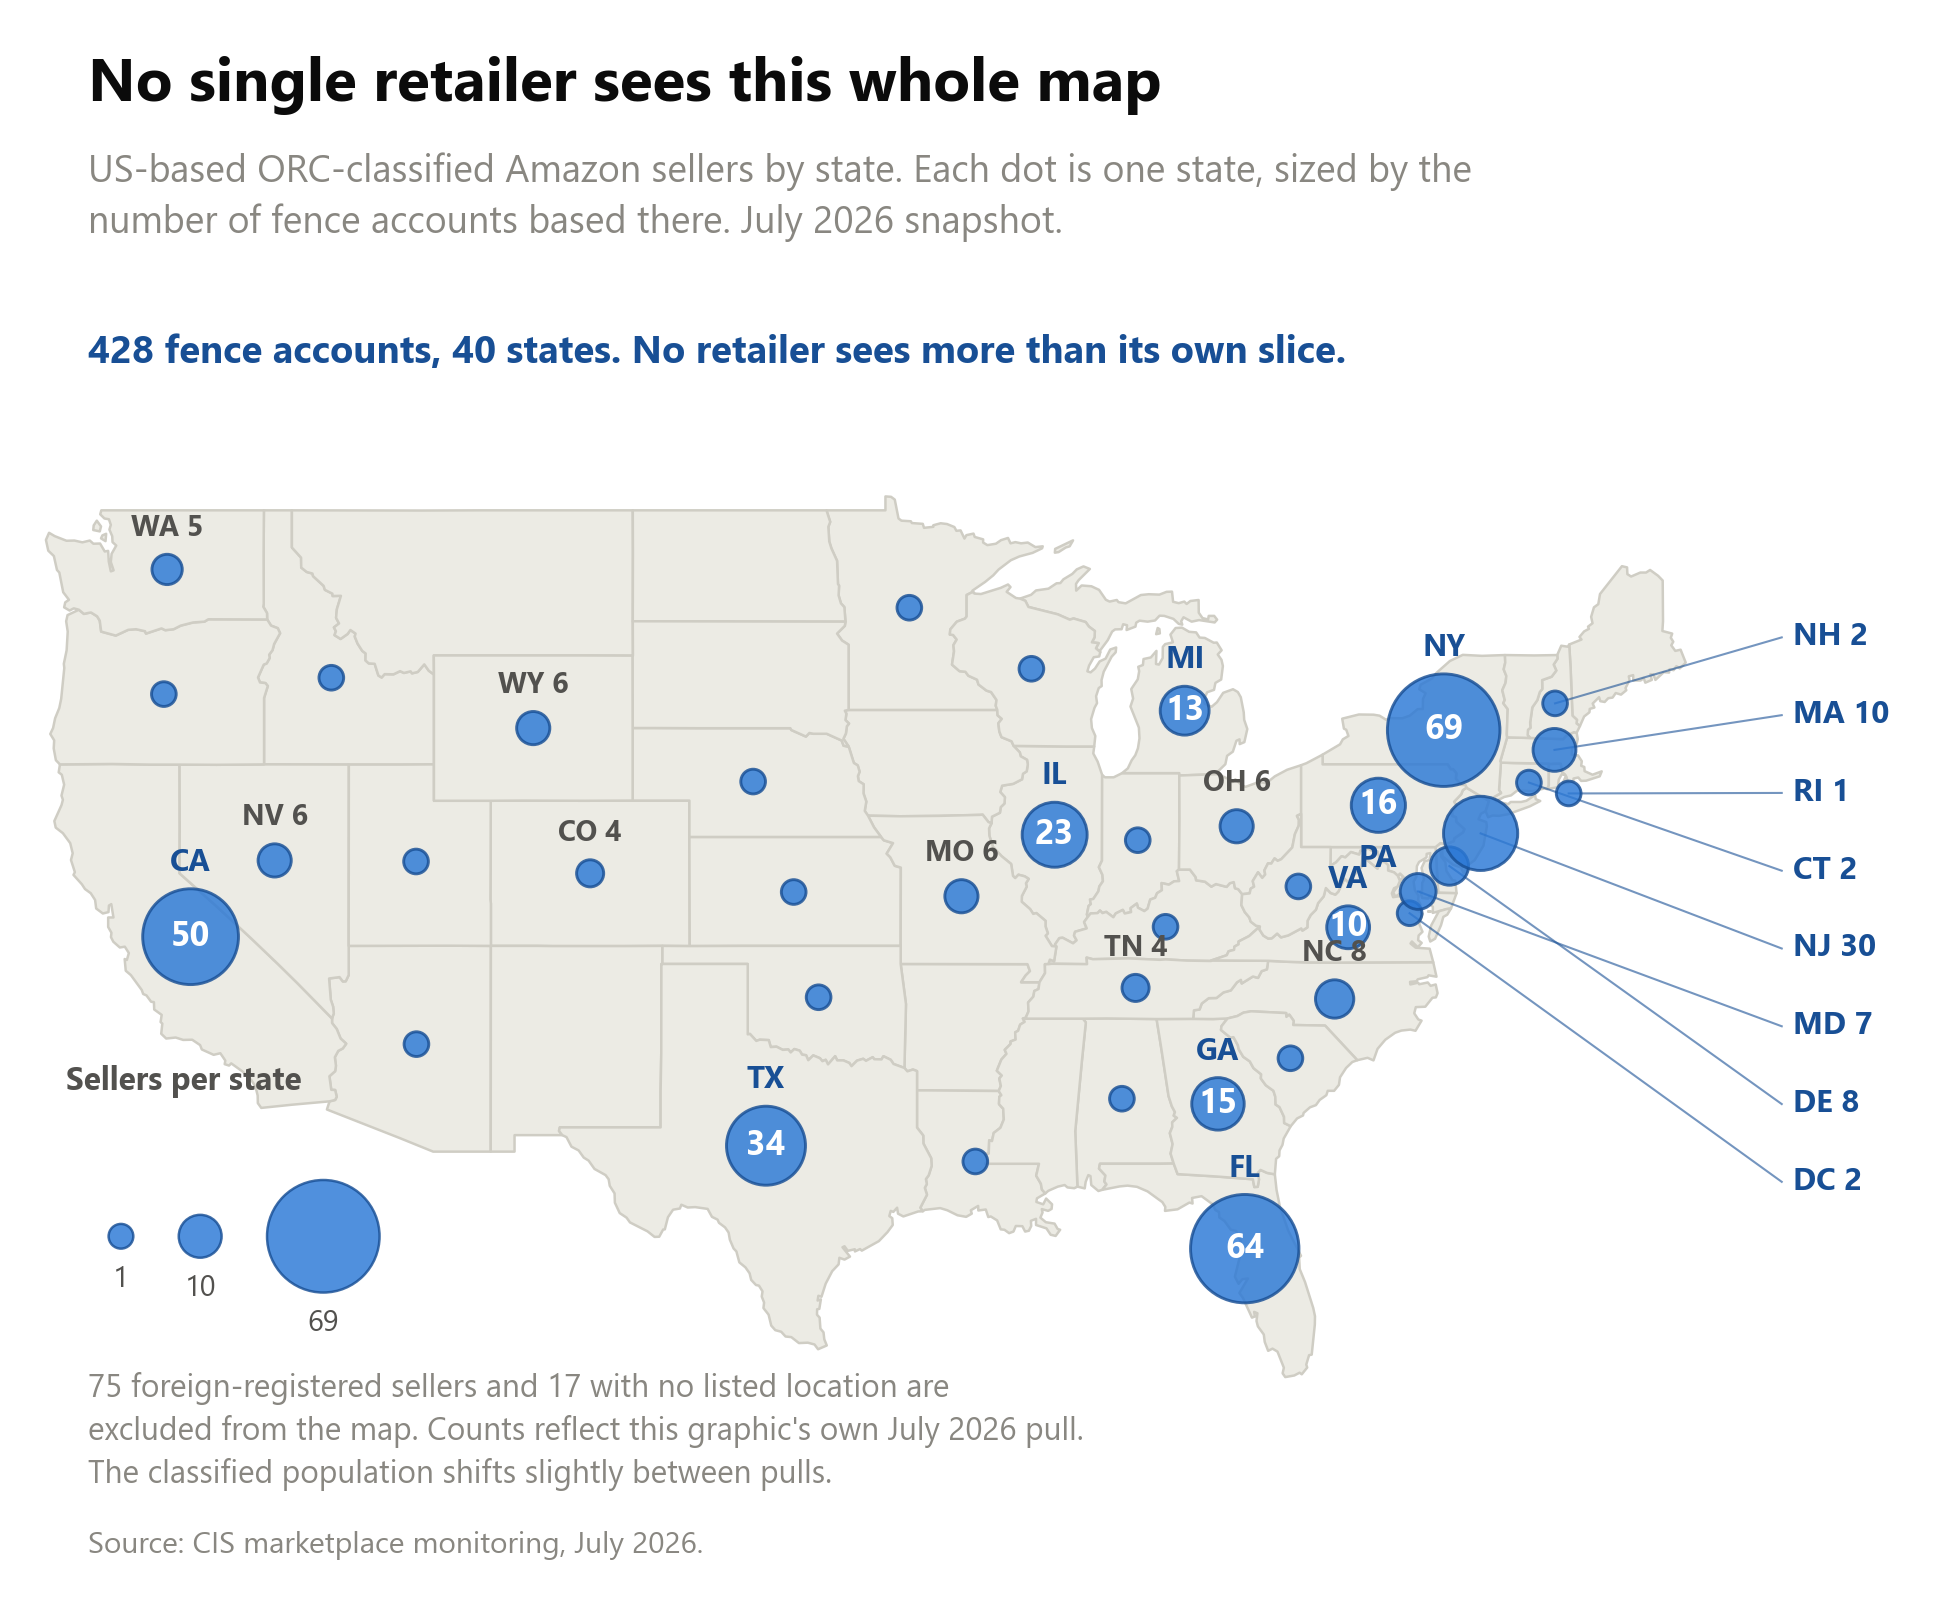
None of this is exotic. That is the point, and it is the same point the Burien storefront made in Part 1. A shop with a “We Buy Gold” sign bought stolen goods for cash and sold them on Amazon under a disclaimer that all but named the source. The whole arc sat in public data for six years before an indictment assembled it. The fence side was visible the entire time. It still is. Over 500 of them are listing right now, shipping their own goods, losing listings at a rate no honest retailer does, hiding in ordinary traffic.
The reason to work that side is not tidiness. It is the choke point. The fence is the demand for everything the boosters carry out the door, and demand is the part of this economy that can actually be squeezed. Make online resale a place where matched lot numbers and scratched-off codes get sellers arrested, and the volume that made boosting worth the risk begins to dry up. Goods that cannot be moved in bulk are not worth stealing in bulk. The supply side has been worked for years and the shelves still empty. The evidence to work the demand side is public, and it has been the whole time. What has been missing is the decision to look at the fence instead of only the shelf.
A Note on Method
The group and network figures in this article are analytical constructs, not adjudicated conspiracies. A “group” means sellers whose catalogs overlap so heavily they behave as one distribution network. A “network” means sellers whose listings are frozen together in the same pattern. Both are directional evidence of coordination, not proof of a legal enterprise, and we name no seller or group from our own data. The revenue figures are snapshot estimates over the sellers who carry one, and coverage is uneven between grouped and solo accounts. For the structural reasons Part 2 laid out, these estimates skew low. A tracker credits each sale only to whoever holds Amazon’s Featured Offer at sample time, and misses what sells off it or in another region. The real pooled figures likely run higher than shown. The channel mapping rests on the roughly 17 percent of catalog rows we could categorize, across 325 of 521 sellers, and it narrows a fence to a kind of store rather than a single chain. Naming the chain and the theft is the retailer-side join, not the catalog alone. The population itself drifts. Part 2 reported 584 classified sellers at its early-July snapshot, and the live figure at this analysis is 521. The classification re-scores continuously, and the standard also tightens as verification work clears sellers. The 63 accounts that left the count between the two snapshots were removed because our clearance process verified them as legitimate. That is a stricter standard at work, not a shrinking problem. Every figure here marks a floor of what is visible, never a ceiling on what exists.
Sources
- Congressional Research Service, R41118 (“fence sheets,” fence-directed boosting): https://www.congress.gov/crs_external_products/R/PDF/R41118/R41118.12.pdf
- Congressional Research Service, R48061 (no federal ORC statute; state-level handling): https://www.congress.gov/crs-product/R48061
- House Judiciary hearing, June 13, 2023 (Kobach testimony; Jackson Lee statement): https://www.govinfo.gov/content/pkg/CHRG-118hhrg52734/html/CHRG-118hhrg52734.htm
- U.S. Government Accountability Office, GAO-11-675 (e-fencing economics): https://www.gao.gov/products/gao-11-675
- U.S. Immigration and Customs Enforcement, HSI Operation Boiling Point: https://www.ice.gov/hsi/news/operations-initiatives/op-boiling-point
- HSI and ACAMS, report on illicit financial flows tied to organized theft groups (2022), roughly $69 billion laundered: https://www.ice.gov/news/releases/hsi-acams-take-aim-organized-retail-crime
- FinCEN, SAR Activity Review case example (2008): grocer laundered at least $69 million for five organized retail theft rings: https://www.fincen.gov/resources/law-enforcement/case-examples/bsa-records-critical-conviction-money-launderer-organized
- National Retail Federation and research partners, The Impact of Retail Theft and Violence 2025 (67 percent transnational figure): https://nrf.com/research/the-impact-of-retail-theft-violence-2025
- New York Attorney General, Rubinov / New Liberty Loans takedown (2022): https://ag.ny.gov/press-release/2022/combating-crime-attorney-general-james-and-mayor-adams-take-down-massive-retail
- Florida Attorney General, Dell / “Anointed Liquidator” charges (2023): https://www.myfloridalegal.com/newsrelease/another-retail-theft-ring-shut-down-attorney-general-moodys-florida-organized-retail
- CNBC, Michelle Mack sentencing: https://www.cnbc.com/2024/07/19/michelle-mack-retail-crime-queenpin-sentenced.html
- CIS proprietary monitored-seller dataset, 2025 to 2026. Keepa historical marketplace data.
About Cyber Investigation Services
Cyber Investigation Services is a licensed private investigation firm with 16 years of work in ecommerce crime. The firm builds intelligence on counterfeit, stolen, and diverted goods moving through online marketplaces, and works with brands and law enforcement to act on it.